Curated OER
A Comparison of Cloud Coverage over Africa
Students identify different climate regions and local weather patterns. For this cloud coverage lesson students use NASA satellite data and import it into Excel.
Curated OER
Scientific Data-The Gift That Keeps on Giving!
In this scientific data activity, students solve 6 problems related to the data to be collected by the Solar Dynamics Observatory Mission. The problems include finding the number of bytes necessary in discs and drives to store a given...
Curated OER
1492: Using Data to Explain a Journey
Students examine how Christopher Columbus made his way across the Atlantic. For this data lesson students use an Internet program to navigate like Columbus.
Curated OER
Using My Nasa Data To Determine Volcanic Activity
Students use NASA satellite data of optical depth as a tool to determine volcanic activity on Reunion Island during 2000-2001. They access the data and utilize Excel to create a graph that has optical depth as a function of time for the...
Curated OER
Surface Air Temperature Trends of the Caribbean
Students use real satellite data to determine the changes in near-surface air temperature at different times of the year over the Caribbean Sea. They discover how Earth's tilt causes seasonal differences in incoming solar energy. They...
Curated OER
Trends of Snow Cover and Temperature in Alaska
Students gather historical snow cover and temperature data from the MY NASA DATA Web site. They compare this data to data gathered using ground measurements from the ALISON Web site for Shageluk Lake. They graph both sets of data and...
Curated OER
Dry Season and 'Green' Season in Costa Rica
Students explore the seasonal changes in Costa Rica. In this dry season lesson students use the Internet to locate science data then generate data for precipitation.
NASA
Speaking in Phases
Hear from deep space. Pupils learn how satellites transfer information back to Earth. They learn about three different ways to modulate radio waves and how a satellite sends information with only 0s and 1s. Using sound, class members...
NASA
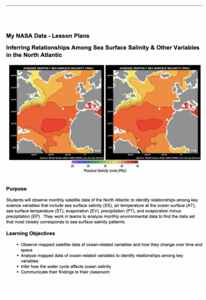
Inferring Relationships Among Sea Surface Salinity & Other Variables in the North Atlantic
Some say a picture is worth a thousand words—even from a hundred miles away! Learners review satellite data to analyze ocean variables such as temperature, salinity, evaporation, and precipitation. They look for patterns in the data and...
Curated OER
Seasons and Cloud Cover, Are They Related?
Students use NASA satellite data to see cloud cover over Africa. In this seasons lesson students access data and import it into Excel.
NASA
NASA
Everything you have ever wanted to know about our solar system, space exploration, and more can be found here. Be prepared to clear your schedule; you will be sucked into the app like a star into a black hole.
National Wildlife Federation
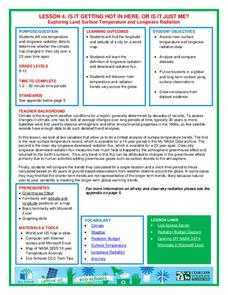
Is It Getting Hot in Here, or Is It Just Me?
Currently, only 2.1% of global warming is felt on continents, while over 93% is felt in the oceans. The fourth lesson in the series of 21 on global warming is composed of three activities that build off one another. In the first...
NASA
Precipitation
Here is a fabulous collection of lessons for your emerging meteorologists! In them, learners will utilize satellite data to determine distribution of rainfall, research global rainfall patterns, and utilize their knowledge to propose new...
Curated OER
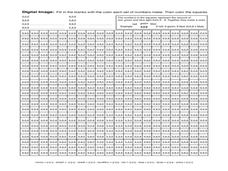
Imagers: The Adventure of Echo the Bat Number to Pictures: How Satellite Images are Created
Students examine the three primary colors of light and design a numerical code to represent those colors. They tell how satellites use numbers to create satellite images after completing a number of experimental activities.
Curated OER
Data Corruption by High-Energy Particles
In this data corruption by high-energy particles, students solve 4 problems about the solar flare that corrupted the imagers measuring them. Students find the speed of the arriving particles and the percentage of light-speed the...
Curated OER
Water Resources
Students study water resources that are important to the people of North American and Africa. They use satellite images and data to explore how human actions can degrade, improve, or maintain water resources. They analyze and interpret...
Curated OER
Trends of Snow Cover and Temperature in Alaska
Students compare NASA satellite data observations with student surface measurements of snow cover and temperature. They practice data collection, data correlations, and making scientific predictions.
Curated OER
Correlation of Variables by Graphing
Middle and high schoolers use a spreadsheet to graph data. In this graphing lesson, learners determine how two parameters are correlated. They create a scatter plot graph using a computer spreadsheet.
Curated OER
The Global Precipitation Measurement Mission (GPM) Lesson
Introduce your class to one of the ways that technology is benefiting humanity. The Global Precipitation Measurement Mission involves the data collected by nine satellites from different countries with a united focus on studying world...
Curated OER
How Much Water Is Available In The Atmosphere For Precipitation?
Students explore the relationship between the available water in the atmosphere and how it is portrayed on satellites. After examining global moisture and precipitation students research precipitation data graph the results. Using their...
Curated OER
Tropical Atlantic Aerosols
Learners analyze NASA data from the Multi-angle Imaging Spectroradiometer. In this NASA data lesson, students access an assigned website to examine information from the MISR on the Terra Satellite. They determine how desert dust travels...
Curated OER
Satellite Technology
In this satellite technology worksheet, students read about Low Earth Orbit satellites and the frictional drag from the Earth's atmosphere that causes them to fall back towards the Earth. Students use given data of the years the...
Curated OER
Solar Proton Events
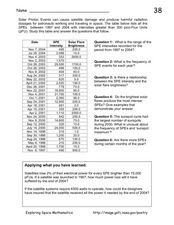
On this worksheet, space scientists use a data table to answer questions about the relationship between the brightness of solar flares and the intensity of the solar proton events. They apply what they learned from the data to address...
NASA
Earth’s Energy Budget - Seasonal Cycles
Earth's energy budget should be in the red. Young researchers review satellite data in a presentation to study Earth's solar radiation. They make both qualitative and quantitative observations about variations in available seasonal...


