Hi, what do you want to do?
CK-12 Foundation
Ck 12: Statistics: Scatter Plots and Linear Correlation
[Free Registration/Login may be required to access all resource tools.] In this tutorial, students learn how to interpret data through the use of a scatter plot.
Other
Correlation Coefficients
This page provides a good discussion of correlation coefficients (r,) which indicate the "strength of the linear association between variables." Includes formulas and scatter plots. Some prior knowledge of statistics might be helpful.
Houghton Mifflin Harcourt
Houghton Mifflin Harcourt: Saxon Activity Center: Graphing Calculator Activity: Positive and Negative [Pdf]
Order of operations with positive and negative numbers is the focus of this graphing calculator lesson. Included are detailed examples, demonstrations of key functions, and practice problems. Acrobat Reader required.
National Institute of Standards and Technology (NIST)
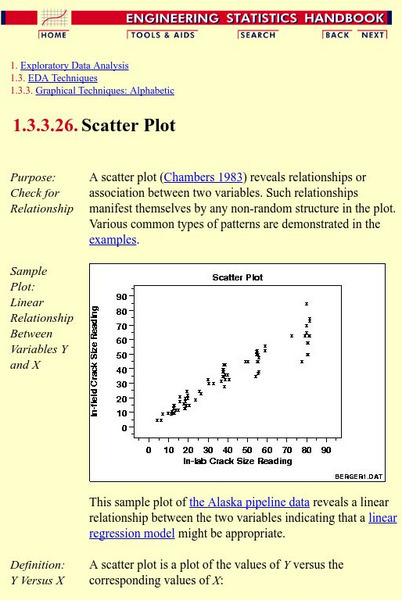
Nist: Engineering Statistics Handbook: Scatter Plots and Linear Regression
An explanation of scatter plots followed by examples of the many different kinds of scatter plots.
Cuemath
Cuemath: Scatter Plot
A comprehensive guide for learning all about scatter plots with definitions, how to construct and solve them, types of scatter plots, solved examples, and practice questions.
Other
Stat Soft: Statistics Glossary
Dozens of statistical terms are defined and illustrated in this glossary.
Houghton Mifflin Harcourt
Holt, Rinehart and Winston: Homework Help Independent Practice: Scatter Plots
Get independent practice working with scatter plots. Each incorrect response gets a text box explanation and another try. Correct responses are confirmed.
Texas Education Agency
Texas Gateway: Interpreting Scatterplots
Given scatterplots that represent problem situations, the student will determine if the data has strong vs weak correlation as well as positive, negative, or no correlation.
Alabama Learning Exchange
Alex: The Path to Positive
Using the story Less than Zero by Stuart Murphy, students relate money matters to positive and negative numbers as a real-life correlation. Incorporated into this lesson, students play the path to positive game where they are required to...


![Houghton Mifflin Harcourt: Saxon Activity Center: Graphing Calculator Activity: Positive and Negative [Pdf] Unknown Type Houghton Mifflin Harcourt: Saxon Activity Center: Graphing Calculator Activity: Positive and Negative [Pdf] Unknown Type](https://static.lp.lexp.cloud/images/attachment_defaults/resource/large/FPO-knovation.png)


