Varsity Tutors
Varsity Tutors: Hotmath: Practice Problems: Correlation and Lines of Best Fit
Twenty problems present a variety of practice determining correlation based on data in a scatter plot and using lines of best fit with given data. They are given with each step to the solution cleverly revealed one at a time. You can...
PBS
Pbs Learning Media: How to Use Correlative Conjunctions
Either, nor? Or, neither? Neither! You use correlative conjunctions in connecting two equal grammatical items. If a noun follows "either," then a noun will also follow "or." If a noun follows "neither," then a noun will also follow...
Texas Instruments
Texas Instruments: Scatterplots and Correlation With Ti 89
Students input data relating the values of one variable associated with values of another and use these data to generate a scatterplot. From the scatterplot, they determine whether there is a correlation between the two variables and...
Texas Instruments
Texas Instruments: Describing Bivariate Data (Two Quantitative Variables)
Students explore the relationship between two quantitative variables in bivariate data using various x-y plots. They compare the relationships for several categories on the same plot. Students calculate the correlation coefficient to...
Science Education Resource Center at Carleton College
Serc: The Evolution of Pearson's Correlation Coefficient
For this activity, students explore nine scatter plots to develop their understanding of how two quantitative variables are related. Through an exploration of the properties of this association, they come to understand the standard...
CK-12 Foundation
Ck 12: Statistics: Rank Sum Test and Rank Correlation
[Free Registration/Login may be required to access all resource tools.] This Concept introduces students to the rank sum test and rank correlation for two non-paired samples.
Texas Instruments
Texas Instruments: Scatterplots and Correlation With Ti 83
Students learn how to enter a list of data and use these lists to graph two-variable statistics. They learn how to analyze the resulting scatterplots to assess the correlation between two variables.
National Council of Teachers of Mathematics
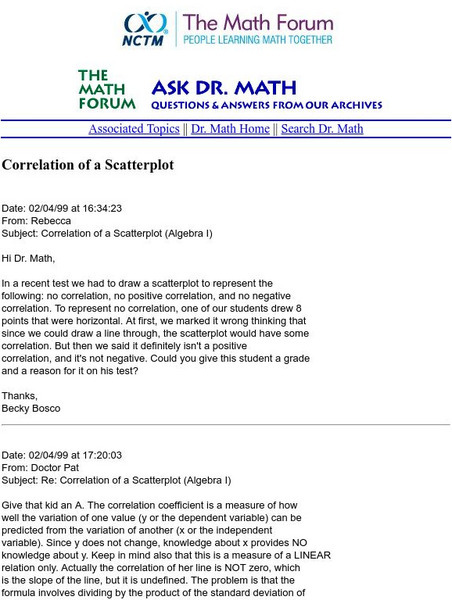
The Math Forum: Nctm: Ask Dr. Math: Correlation of a Scatterplot
This page from Ask Dr. Math describes the correlation of a scatterplot and gives an example of one with no correlation.
ClassFlow
Class Flow: Two Bad Ants
[Free Registration/Login Required] This flipchart correlates with the Scott Foresman Grade 3 textbook. It preteaches the main comprehension skill which is recognizing the aspects of the literary genres realism vs. fantasy; has...
Ministry of Education and Universities of the Region of Murcia (Spain)
Ministerio De Educacion Y Ciencia: Variable Estadisticas Bidimensionales
In Spanish. This interactive unit shows you the statistical relationship between two variables.
Sophia Learning
Sophia: Conjunctions: An Introduction
This slideshow lesson focuses on conjunctions; it defines conjunctions. It explains each of the three types of conjunctions: coordinating, subordinating, and correlative. It defines each, lists the conjunctions, and provides sentences...
ClassFlow
Class Flow: Two Sounds of G
[Free Registration/Login Required] This flipchart is correlated to Houghton Mifflin Grade 2 reading series. It reviews words with soft and hard g sounds, and includes a song, sound clips, interactive sorting, and classifying, spelling...
Alabama Learning Exchange
Alex: The Path to Positive
Using the story Less than Zero by Stuart Murphy, young scholars relate money matters to positive and negative numbers as a real-life correlation. Incorporated into this lesson, students play the path to positive game where they are...
Texas Instruments
Texas Instruments: Numb3 Rs: "Take Out" Outliers
Based off of the hit television show NUMB3RS, this lesson has students create box-and-whisker plots for given data, and then determine which (if any) data points are outliers. Students determine outliers through two methods in this...
Houghton Mifflin Harcourt
Houghton Mifflin Harcourt: Saxon Activity Center: Calculator Activity 5: Division [Pdf]
A worksheet for practicing basic division facts and word problems using a calculator. Includes detailed examples. Acrobat Reader required.
Houghton Mifflin Harcourt
Houghton Mifflin Harcourt: Saxon Activity Center: Graphing Calculator Activity: Positive and Negative [Pdf]
Order of operations with positive and negative numbers is the focus of this graphing calculator lesson. Included are detailed examples, demonstrations of key functions, and practice problems. Acrobat Reader required.
Houghton Mifflin Harcourt
Houghton Mifflin Harcourt: Saxon Activity Center: Graphing Calculator Activity: Average [Pdf]
A concise graphing calculator lesson on calculating average. Detailed examples, demonstrations of calculator functions, and practice problems included. Acrobat Reader required.
Houghton Mifflin Harcourt
Houghton Mifflin Harcourt: Saxon Activity Center: Graphing Calculator Activity: The Coordinate Plane [Pdf]
A graphing calculator lesson on coordinate planes. Detailed examples, demonstrations with key functions, and practice problems included. Acrobat Reader required.
University of Baltimore
University of Baltimore: Alternative Approach for Estimating a Regression Line
A quick, three-step approach to estimating the regression line of a set of data known as the "distribution-free method." Written by Dr. Hossein Arsham
University of Illinois
University of Illinois Urbana Champaign: Ridgely Learning Community: A Century of Pride
Ten different lesson plans around the concept of community aimed toward early elementary students can be found here. Each lesson plan contains an introductory activity, contains an assessment rubric and correlates state standards and...
TeachEngineering
Teach Engineering: Can You Resist This?
This lab demonstrates Ohm's law as students set up simple circuits each composed of a battery, lamp and resistor. Students calculate the current flowing through the circuits they create by solving linear equations. After solving for the...
California State University
Cal State San Bernardino: Bivariate Distribution Applet
The applet is a target at which green darts are shot either with a strict correlation to each other or without -- the user defines this. A good example of how bivariate data is truly influenced by two variables, possibly dependent upon...
Houghton Mifflin Harcourt
Houghton Mifflin Harcourt: Saxon Activity Center: Graphing Calculator Activity: Common Denominators [Pdf]
A graphing calculator lesson focusing on common denominator. Lesson contains detailed examples, visual demonstrations with key functions, and practice problems. Acrobat Reader required.
Curated OER
Ricitos De Oro
Great exercise for practicing the preterite and imperfect tenses. Provide the correct form of verb infinitives that complete the story of Goldilocks and the Three Bears. Immediate feedback corrects the answer. Correlates to another...


