Curated OER
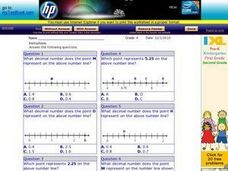
Decimals on the Number Line
In this number lines activity, learners choose which decimal point the letters represent on a number line, and what decimal number the letters represent. Students complete 10 multiple choice questions.
Curated OER
Number 3
For this number three worksheet, young scholars trace 11 number three figures. Each figure is printed in a dot pattern and three koala bears are shown for students to count.
Curated OER
Dot-to-Dot Puzzle- Numbers 1-47
In this dot-to-dot puzzle, 2nd graders start at the number one and continue drawing lines between the numbers until the finish at the number forty-seven. They draw a teddy bear by completing the puzzle.
Curated OER
Apple Basket Dot to Dot - Skip Counting by 5 's
In this skip counting learning exercise, 2nd graders complete a dot to dot puzzle. They start at the number 5 and follow the dots by skip counting by 5's to 100. They complete a picture of an apple basket.
Curated OER
Jack O Lantern Dot to Dot Activity
In this Halloween worksheet, students complete a dot to dot Jack O Lantern puzzle by starting at the number 1 and following through to the number 24. They count the numbers as they complete the picture.
Curated OER
r and n
Here is some kid-friendly practice with the letters r and n that will ignite your scholars' artistic sides. They connect the dots to trace the lowercase letters before copying them in the space provided. There are two...
Curated OER
What Shapes Can You See?
This clown is missing some things, and young counters sequence single-digit numbers to complete this juggling act. They connect four separate connect-the-dots sequences to create two triangles and two squares, then complete three more...
EngageNY
Connecting Graphical Representations and Numerical Summaries
Which graph belongs to which summary statistics? Class members build upon their knowledge of data displays and numerical summaries to connect the two. Pupils make connections between different graphical displays of the same data in...
EngageNY
Describing Distributions Using the Mean and MAD
What city has the most consistent temperatures? Pupils use the mean and mean absolute deviation to describe various data sets including the average temperature in several cities. The 10th instructional activity in the 22-part series asks...
EngageNY
Understanding Box Plots
Scholars apply the concepts of box plots and dot plots to summarize and describe data distributions. They use the data displays to compare sets of data and determine numerical summaries.
Santa Monica College
Lewis Structures and Molecular Shapes
Learners practice drawing Lewis dot structures, build molecules with model kits, and predict molecular shapes using VSEPR theory. The combination of written work and hands-on reinforcement benefits young scientists.
EngageNY
Summarizing a Distribution Using a Box Plot
Place the data in a box. Pupils experiment with placing dividers within a data set and discover a need for a systematic method to group the data. The 14th activity in a series of 22 outlines the procedure for making a box plot based...
American Statistical Association
Bubble Trouble!
Which fluids make the best bubbles? Pupils experiment with multiple fluids to determine which allows for the largest bubbles before popping. They gather data, analyze it in multiple ways, and answer analysis questions proving they...
EngageNY
More Practice with Box Plots
Don't just think outside of the box — read outside of it! The 15th lesson in a 22-part unit provides pupils more work with box plots. Learners read the box plots to estimate the five-number summary and interpret it within the context....
Homeschool Den
Bob Book Worksheet Pack
Practice fundamental reading and number skills with a packet of worksheets for early readers. Pupils find sight words, trace letters, and complete number sequences.
EngageNY
Describing Distributions Using the Mean and MAD II
The 11th lesson plan in the series of 22 is similar to the preceding lesson plan, but requires scholars to compare distributions using the mean and mean absolute deviation. Pupils use the information to make a determination on which data...
BBC
Walking with Dinosaurs
Breath new life into your class's study of dinosaurs with this extensive collection of materials. Offering everything from a printable T-rex mask, word searches, and connect-the-dots activities to informational handouts, hands-on...
Computer Science Unplugged
The Peruvian Coin Flip–Cryptographic Protocols
A digital flip. Introduce your classes to cryptographic protocols using and, or, and not gates. Groups create a complete circuit to convert a binary number into another one. This type of one-way function allows pupils to...
EngageNY
Comparing Data Distributions
Box in the similarities and differences. The 19th lesson in a unit of 22 presents class members with multiple box plots to compare. Learners use their understanding of five-number summaries and box plots to find similarities and...
Statistics Education Web
How High Can You Jump?
How high can your pupils jump? Learners design an experiment to answer this question. After collecting the data, they create box plots and scatter plots to analyze the data. To finish the lesson, they use the data to draw conclusions.
Houghton Mifflin Harcourt
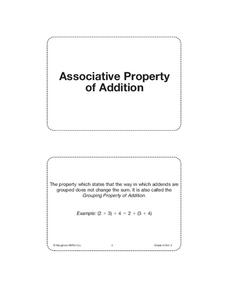
Unit 2 Math Vocabulary Cards (Grade 3)
A set of third grade math vocabulary cards include topics that range from addition properties to terms like estimate and fact family. Each sheet has two cards on it. The top half is the word printed in bold text,...
Achieve
BMI Calculations
Obesity is a worldwide concern. Using survey results, learners compare local BMI statistics to celebrity BMI statistics. Scholars create box plots of the data, make observations about the shape and spread of the data, and examine the...
Bowland
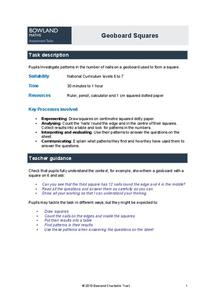
Geoboard Squares
Don't be a square! Help your budding mathematicians discover patterns within squares. Scholars create squares on geoboards and identify patterns in the number of nails, both nails on the edge of the squares and nails within the squares....
CK-12 Foundation
Absolute Values of Integers
A five-question interactive focuses on integers and absolute value. A number line shows the distance to aide mathematicians in answering multiple-choice, true or false, and discussion questions.
