Agriculture in the Classroom
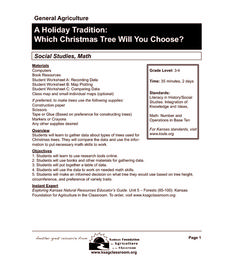
A Holiday Tradition: Which Christmas Tree Will You Choose?
Different varieties of Christmas trees provide an interesting way to combine social studies, science, math, and technology. Class members not only research the history of the Christmas tree holiday tradition, they compare and contrast...
Curated OER
Virtual Field Trip
Are we there yet? Young trip planners learn about their state and plan a trip. They will select sites to see in three cities in their state, and record associated costs in a spreadsheet. While this was originally designed as a...
Curated OER
Graphing Pendulum Results
Sixth graders set up a pendulum experiment deciding which variable to manipulate (length of string or weight on the string). They create a hypothesis, collect necessary equipment, and write out each step of their experiment. They then...
Curated OER
Get Ready For Some Football
Sixth graders compare and contrast the totals from two national football teams for the year. Using the internet, they search for the information they need and create a data bar graph. They use the information they collected to answer...
Curated OER
Graphing Names in Historic Cemetery
Students collect information from headstones about names of the deceased in their local community. They determine the most common names and graph them. They discuss their findings with the class.
Curated OER
"You're Hired!'
Students investigate linear programming using the TI. In this algebra lesson, students collaborate and graph linear inequalities on a TI. They analyze their data and present it to the class.
Curated OER
Statistical Accuracy and Reliability
Ninth graders assess the accuracy and reliability of current survey data and how it is represented. They design a survey, collect data, and use technology to analyze the data and present the results. Students examine scatter plots and...
Curated OER
Onwards and Upwards
Students analyze a graph representing college tuition increases, consider the possible causes and consequences of these tuition increases and collect data on tuition changes at colleges in the United States by region and graph the data.
Curated OER
Temperature High and Lows
Students gather high and low temperature readings through email. In this temperature graphing lesson, students use a spreadsheet to input data for a graph. students interpret the graphs to compare and contrast the data from different...
Curated OER
Cars on the Curve
Second graders, using two dice, participate in a car race game called Cars on the Curve. They predict which car wins the game and records it in their Data Diary.
Curated OER
Opinions, Please!
Students discuss the meaning and purposes of polls and surveys. After reading an article, they analyze the results of a poll given to residents of New York City. They create a survey of their own and analyze the data to write a written...
Curated OER
Non-Random Variables: NBA Championship
Learners demonstrate probability distribution of non-random variables. Students collect data on the NBA Championships. They record the data and compute subsets and permutations.
Curated OER
Using Patterns
For this math worksheet, 6th graders use the time at home in order to work on the skill of recording data in the form of daily activities and statistics.
Curated OER
Untitled Document Aerospace Team Online:
High schoolers explain the historical significance of use of the scientific method in developing the first airplane and appreciate the process involved in developing a new technology.
American Statistical Association
Exploring Geometric Probabilities with Buffon’s Coin Problem
Scholars create and perform experiments attempting to answer Buffon's Coin problem. They discover the relationships between geometry and probability, empirical and theoretical probabilities, and area of a circle and square.
Curated OER
Connecting Math to Our Lives
Students participate in an online interactive forum to explore how math is used in their families and communities. They design games to submit to other students online, and identify and organize data to solve the problems from other...
Curated OER
Reaction Time
Students record reaction time data and calculate minimum, maximum, mean, median, and mode. They participate in a class reaction time activity, observe and conduct an online experiment, and discuss and analyze the activity results.
Curated OER
Then and Now
Students conduct research and use census data to compare different times and places. In this census activity, students interpret data from charts and graphs, comparing census information from two time periods as well as from two...
Curated OER
Quick Stats with Quick Poll
Learners analyze data using bar graphs and the TI in this statistics lesson plan. They investigate quick polls and graph the data using different properties of statistics. This assignment requires a TI Navigator.
Curated OER
Counting Candies
Young scholars count, sort, and classify jellybeans by color. They use their data to create a bar graph. Students are given a small bag of jellybeans, and a worksheet on Counting Candies Tally Chart. They work in small groups. Young...
Curated OER
Approximation of Pi
Students explore the concept of Pi. In this Pi lesson plan, students measure the circumference and diameter of a circle. Students record the diameter and circumference measurements from their classmates. Students enter the data into...
Curated OER
Jelly Bean's Galore
Students investigate the origins of the Jelly Bean. They complete a Scavenger Hunt using the jellybean website. Pupils create a bar graph using information collected about jelly beans. Students discuss the time of year that Jelly Beans...
Curated OER
Can You Guess The Flavor?
Second graders conduct a tasting experiment. In this senses lesson, 2nd graders read The Five Senses and brainstorm different tastes. They work in pairs, one blindfolded and the other recording. The blindfolded student eats one skittle...
Curated OER
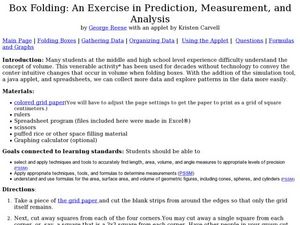
Box Folding: Predict, Analyze and Measure
Students predict the shape of a geometric figure in 3D. In this geometry lesson, students construct 3D shapes to perfect their knowledge of measuring and predicting. This assignment is also available as an online interactive lesson.


