Curated OER
Tower of Hanoi Lesson Plan
Young scholars investigate the Legend of the Tower of Hanoi and complete mathematical problems related to the legend. They play the Tower of Hanoi game online in order to discover the number pattern involved. They solve problems using...
Curated OER
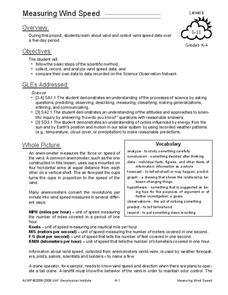
Measuring Wind Speed
Students study wind speed and collect wind speed data. In this wind speed lesson, students visit a website to learn about the local wind speed forecast for their week. Students discuss wind and wind speed. Students collect wind speed...
Curated OER
My Favorite Birthday
Students collect and organize data from classmates, display data on simple chart, and plan class birthday party.
Curated OER
Leap Frog Experiment
Second graders ask questions and design an experiment to explore different spinners in "The Leap Frog" board game. They conduct their experiment, collect information and interpret the results using a graph.
Curated OER
Building Blocks
Students navigate to various websites and play educational games to reinforce learning. In this game lesson, students catalog games to play in various areas of the curriculum;. Students play online and board games.
Curated OER
Normal Probability Plot
Students analyze the graph of a distribution. In this statistics lesson, students define skewed or mound shape distribution as they investigate the data behind the graph. They define and plot outlier as well as normal probability.
Curated OER
POWER OF VOTING
Fifth graders explain the process of a national presidential election by researching through the Internet and holding an election simulation. They collect, graph, and interpret election data. They enhance their computer skills by...
Curated OER
Looking Normal
Young scholars identify the shape of a function. In this statistics lesson, students plot the data collected. They analyze their data for positive, negative or no correlation. They find the line of best fit.
Curated OER
Boxplots Introduction
Students describe the pattern of a bell curve graph. In this statistics lesson, students move data around and make observation about the mean, and the quartiles. They define boxplot, outlier, range and other important vocabulary words...
Curated OER
Dynagraphs
Students collect and graph their data. In this precalculus lesson, students identify the input and out of a function. They find the domain and range and the inverse of a function.
Curated OER
Radiation Reassessed
Students investigate the dangers of radiation by exploring recent nuclear tragedies. In this scientific debate lesson, students define the idea of radiation "half life" and determine if low doses of radiation are truly damaging to a...
Curated OER
Recipe: Unit Rate
Students solve problems using ratios and proportions. In this algebra lesson, students identify the unit rate and convert between fractions and decimals. They create graphs from their data.
Curated OER
Proportionality in Tables, Graphs, and Equations
Students create different methods to analyze their data. In this algebra lesson, students differentiate between proportion and non-proportional graph. They use the TI-Navigator to create the graphs and move them around to make their...
Curated OER
Multiply Boxplots
Students identify the mean, quartiles and range of a boxplot. In this statistics lesson, students identify cooperative boxplot as it relates to the data. They make conjectures about students grade distribution.
Curated OER
Percentiles
Students analyze the bell curve and make predictions. In this statistics lesson, students calculate the percentile to the left of the curve. They then are given the percentile and create the graph from the data.
Curated OER
An Introduction to Public Key Cryptography
Students secure information online using cryptography. In this algebra lesson plan, students use RSA technology to encrypt information on the internet. They use modular reduction of natural numbers to understand prime number theory.
Curated OER
"Slice of Pi with Neo-Excel"
Students explore diameter, radius, and circumference. They define radius, diameter, and circumference on an online dictionary, identify objects in the room with a radius and a diameter, and calculate the radius and diameter of various...
Curated OER
Lesson Plan for Fontana Mines
Pupils estimate and compute with rational numbers. They compare, order and convert among fractions, decimals and percents. Students analyze problems to determine if there is sufficient or extraneous data to solve.
Curated OER
Heads-Up Probability
Second graders use tree diagrams to predict the possible outcomes of coin tosses. The data they collect and graph also help them predict the likelihood of getting heads or tails when tossing coins the next time.
Curated OER
Make a Windmill
Students explore Earth science by conducting an energy experiment in class. In this windmill lesson, students identify how wind has been used to pump water throughout history and the latest developments wind energy has produced. Students...
Curated OER
Graphing With Candy
Young scholars gather information and interpret the results using a tally chart, a table, and a bar graph.
Curated OER
Apple Baskets
In this counting apples worksheet, students color and cut out four apple baskets with specific numbers on them and twenty-five apples. Students fill each basket with the specific number of apples requested.
Curated OER
You Bet!
Students explore the mathematical probabilities involved in gambling and how these factors affect people's behavior. They work in pairs and conduct and experiment pertaining to blackjack. The class creates a graph showing the trends found.
Curated OER
Who Represents You?
Students investigate Congress and how individuals are represented in this Country. In this government instructional activity, students complete worksheets research government web sites to determine which senators and congressmen...


