Curated OER
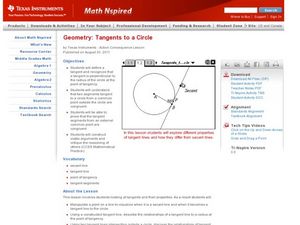
Tangents to a Circle
Young scholars construct tangent lines. In this geometry lesson, students identify the point of tangency, secant and tangent lines. They graph the lines on the Ti and make observations.
Curated OER
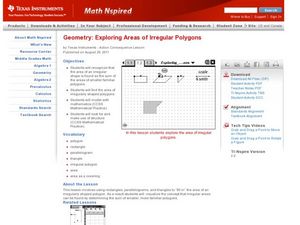
Exploring Areas of Irregular Polygons
Students solve for the area of different polygons. In this geometry lesson, students identify and differentiate between regular and irregular polygons. They use properties of irregular polygons to solve problems.
Curated OER
Fixed Perimeter Rectangle
Teach how to solve for the area and perimeter of rectangles. In this geometry lesson, learners are given fixed perimeter rectangles and asked to find the area and side length of the rectangles. they draw their rectangle on the navigator...
Curated OER
Transformations: Dilating Functions
Students dilate functions using transformation. In this algebra lesson, students complete vertical dilation, stretch and shrink. They perform reflection across the x and y axis.
Curated OER
Transformations and Translation of Functions
Students translate functions horizontally and vertically. In this algebra lesson, students identify the parts of the formula that allows the graph to move left, right, up and down. They perform a transformation on the coordinate plane.
Curated OER
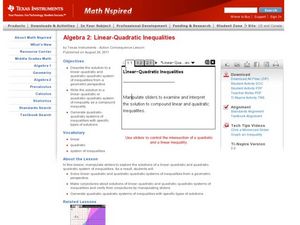
Linear-Quadratic Inequalities
High schoolers graph linear and quadratic functions. In this algebra lesson, students create graph with specific coordinate points. They use the Ti to visualise and differentiate between the two functions.
Curated OER
Factoring Trinomials
Learners factor trinomials using patterns and their TI to graph their results and make predictions through this lesson. This is accomplished by solving quadratic equations through FOIL and algebra tiles.
Curated OER
The Function Elevator
Students solve and graph functions. In this precalculus lesson plan, students use piecewise function to relate real life scenarios. They analyze the graphs and identify the vertex and intercepts.
Curated OER
Position and Piecewise Velocity
Young scholars solve piecewise functions. In this precalculus lesson, students model real life scenarios using velocity and piecewise. They create velocity graphs and find the beginning and end position of an object.
Curated OER
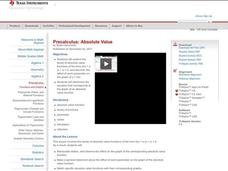
Absolute Value
Learners solve equations with absolute value bars. In this precalculus lesson, students graph and identify the vertex and translation of absolute value functions. They match equations with given graphs.
Curated OER
Perfect Shuffles
Students investigate piecewise functions. In this algebra lesson, students model piecewise functions in the real world. They graph the parts of the functions following the restrictions of the domain.
Curated OER
Dynagraphs
Students collect and graph their data. In this precalculus lesson, students identify the input and out of a function. They find the domain and range and the inverse of a function.
Curated OER
End Behavior of Polynomial Functions
Students identify the end behavior of polynomial functions. In this algebra instructional activity, students graph different polynomials functions and find a correlation between exponents and function behavior. They identify the effect...
Curated OER
Products of Linear Functions
Students investigate the horizontal intercepts of functions. In this algebra lesson, students identify whether the factor of two functions results in a quadratic equation or not. They compare and contrast linear equations and higher...
Curated OER
Rational Functions
Students evaluate rational functions. In this precalculus lesson, students make observations and define what makes a rational function and what makes a linear function. They use the Ti calculator to visualize the different graphs.
Curated OER
Crossing the Asymptote
Students investigate graphs and their asymptotes. In this precalculus instructional activity, students examine the numerator and denominator of their rational functions. This helps them identify where and when the graph will cross its...
Curated OER
Logarithmic Transformations of Data
Students investigate and study logarithmic equations. In this precalculus lesson, students analyze the data behind the function. They define each graph as positive, negative or no correlation. They find the line of best fit.
Curated OER
Trigonometric Transformations
Students perform transformation on trig functions. In this precalculus lesson, students relate the London Eye observation wheel to trig function. They use a TI navigator to visualise the parameter created by this view and relate it to...
Curated OER
The Unit Circle
Students solve problems using the unit circle. For this precalculus lesson, students identify angles using the properties of the unit circle. They observe the trigonometric graphs and sine, cosine and tangent.
Curated OER
How to Make Histograms
Young scholars collect data and plot it using a histogram. In this statistics lesson plan, students interpret histograms. They find the frequency, percents and density.
Curated OER
Multiply Boxplots
Students identify the mean, quartiles and range of a boxplot. In this statistics lesson plan, students identify cooperative boxplot as it relates to the data. They make conjectures about students grade distribution.
Curated OER
Measure of Spread
Students identify the standard deviation. In this statistics lesson, students find the mean distribution and calculate the percent of deviation from the mean. They observe this change on the Ti calculator.
Curated OER
How Far is Far?
Students calculate the standard deviation of data. For this statistics lesson, students collect data, plot it and analyze it. They identify the mean, median and range of their data.
Curated OER
Normal Probability Plot
Pupils analyze the graph of a distribution. In this statistics lesson, students define skewed or mound shape distribution as they investigate the data behind the graph. They define and plot outlier as well as normal probability.


