Curated OER
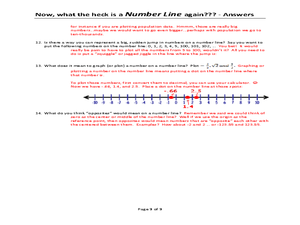
Now, what the heck is a NUMBER LINE again???
A unique approach to reviewing number lines and how to locate different values on them, this worksheet poses several questions that require written answers rather than calculations. You could use this as a note-taking guide when teaching...
Curated OER
Cutting Up in Class, Fractal Style
Students create three-dimension models demonstrating exponents, multiplying and dividing of fractions, and the use of repeating patterns in tessellations, mirror images, and tiling.
Curated OER
Making a Circle Graph of a Sample Budget
Students examine a sample budget and categorize the entries as a group. Then in small groups they convert budget category totals to percents and degrees to make a circle graph related to a sample budget.
Curated OER
Who Wants to Carry a Million?
Students, in groups, determine the volume of a box large enough to hold a million dollars. They calculate the dimensions of a bill and the volume of the money.
Curated OER
Conversions: Metrics Made Easy
Students, in groups, measure and record each other's height. They identify measurement conversion methods and use online resources to convert measured heights to multiple systems.
Curated OER
Graphing
Students collect data to create different types of graphs-line, pie, and bar graphs. They use StarOffice 6.0 to create graphs.
Curated OER
Estimation
Students estimate the cost of individual items found on a typical grocery list. They participte in a teacher-led demonstration, solve word problems, and estimate the cost of ten items placed into their group's grocery basket.
Curated OER
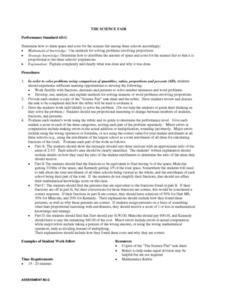
Science Fair Space
Students determine the most equitable way to share space and cost between three schools for a fictional science fair. Given a diagram, a word problem, and a data set, students analyze and explain the best way for all schools to share...
Curated OER
Whole Numbers
Student are assigned one of the sections on whole numbers. After reviewing the content, they teach their assigned sections to other class mates. They publish their findings on a PowerPoint slide show to use when they teach their section.
Curated OER
Rings Around the Racetrack
Students determine the number of laps a driver would need to complete the Indy 500. They calculate the length of time it would take to complete the race at different rates of speed.
Math Mammoth
Decimal Problems
In this math worksheet, students are given tables and story problems with decimal points. Students must use the tables and story problems to find 10 answers about the data.
Curated OER
Rita's Ice Problem
In this algebra worksheet, 11th graders calculate how many different choices they can create making their icy. The have a choice of 26 different flavors of ice and 5 different flavors of ice cream. There is a solution to this problem.
Pennsylvania Department of Education
Freckle Face
Students collect and record data. In this early data analysis lesson plan, students gather data about their partners face. As a class, the students use tally marks and pictographs to record the data and answer question about the...
Other popular searches
- Comparing Ordering Decimals
- Ordering Decimals Activity
- Ordering Decimals Fractions
- Ordering Decimals Rating=3
- Ordering Decimals Worksheets
- Ordering Decimals 2nd Grade
- Decimals: Ordering Decimals
- Ordering Decimals Time
- Decimals Ordering Decimals
- Ordering Decimals Quiz
- Ordering Decimals Numbers


