Curated OER
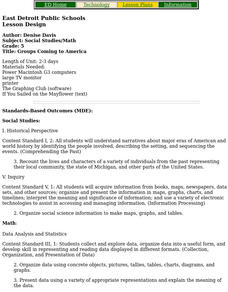
Groups Coming to America
Fifth graders use text or other references to locate different types of information about the Mayflower and pilgrims. They create a presentation for lower elementary classes about the Pilgrims.
Curated OER
A Bird's Eye View of our 50 States
Third graders focus on state birds as they learned absolute location (latitude/longitude) of each state, as well as their relative location (bordering states).
Curated OER
Statistics and Shopping
Students explore the concept of using consumer data and statistics to aid in the consumer decision making process. In this consumer data and statistics lesson, students research consumer data and statistics. Students analyze the data...
Curated OER
Keep It Cool
Students complete a science experiment to study insulation, heat transfer, and permafrost. In this permafrost study lesson, students design and test a soda insulator. Students graph their class data and discuss the results. Students...
Alabama Learning Exchange
The Very Hungry Class
Students listen to a read aloud of Eric Carle's, The Very Hungry Caterpillar, as an introduction to their study of the metamorphosis of a butterfly. They participate in a number of cross-curricular activities in this unit of lessons.
Curated OER
Jelly Belly: What a Wonderful "Bean"!
Students explore how jelly beans are produced. They discuss the origins of the jelly bean and view a video about how jelly beans are prepared, tested, shaped, finished, and shipped and estimate the amount of jelly beans in a jar and sort...
Curated OER
Linking Algebra to Temperature
Learners convert between two units as they calculate the temperature. In this algebra lesson, students collect data on seasonal climate and create a graph. They make conjectures based on their data collection.
Alabama Learning Exchange
Meteor or Meteorite
Students differentiate between a meteor and meteorite. They participate in an experiment to discover how the size and weight of an object determines the size of the impact crater. They utilize their math skills by measuring with a ruler...
Curated OER
Harry Potter Research Project
Students work together to complete a research project on Harry Potter. They write a research question and develop a survey to give to their classmates. Using the results, they create a graph and draw conclusions about the data collected.
Curated OER
Probability With a Random Drawing
Students define probability, and predict, record, and discuss outcomes from a random drawing, then identify most likely and least likely outcomes. They conduct a random drawing, record the data on a data chart, analyze the data, and...
Curated OER
Design Patterns in Everyday Life
Students find symbols and patterns in everyday life. In this patterns lesson, students break into groups and look for specific patterns and symbols. Students record their findings. Students create a graphic organizer with the information.
Curated OER
Education for Global Peace
Students survey the class and graph the results. In this graphing and data collection lesson, students conduct a survey to see where their shirts were produced. Individuals use software to graph the results and create a written...
Curated OER
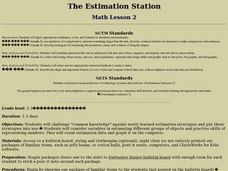
The Estimation Station
Students challenge "common knowledge" against newly learned estimation strategies and put those strategies into use. They consider variables in estimating different groups of objects and practice skills of representing numbers.
Curated OER
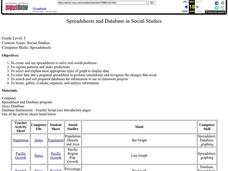
Spreadsheets and Database in Social Studies
Fifth graders create/use spreadsheets to solve real-world problems, explore patterns and make predictions, select/explain most appropriate types of graph to display data, and enter data into a prepared spreadsheet to perform calculations.
Curated OER
The Ultimate Vacation
Students use research skills to solve a problem. They research information needed to plan a vacation. Students create a letter, a flyer, an itinerary, an activity list, cost spreadsheet, a reference page, table of contents and a title page.
Curated OER
Design-A-Room Project (Part 3 of 3)
Young scholars culminate a unit on measurement with a focus on area and perimeter. They design a floor plan of their dream room on graph paper showing the proper area and perimeter. They plan the budget for their room and make a 3-D...
Curated OER
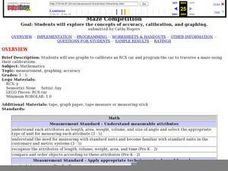
Car Maze competition
Students use graphs to calibrate an RCX car. They must then program the car to traverse a maze using their calibrations
Curated OER
Different Perspectives of Oregon's Forest Economic Geography
Students map data on employment in wood products manufacturing in Oregon counties. In this Oregon forest instructional activity, students discover the percentage of people employed in the forest manufacturing industry. Students create a...
Curated OER
More Bait for Your Buck!
Students determine where to buy the heaviest earthworms as they study invertebrates. They create a double bar graph of the results of the weight data.
Curated OER
Box-and-Whisker
Seventh graders are introduced to the concept of box-and-whisker plots. A step-by-step process for creating a box-and-whisker plot is provided. The goal of the lesson is that students study the components of a box-and-whisker plot and be...
Curated OER
Testing the Waters
Eleventh graders examine a local body of water. In this science lesson, 11th graders collect water samples to test. Students analyze the data and make conclusions. Students create tables and graphs of the data.
Curated OER
Statistics: Misleading or Accurate?
Students explore the concept of misleading statistics. In this misleading statistics lesson plan, students play a game of tag and graph the number of times each student gets tagged. Students use the graph to determine the fastest...
Curated OER
Box Plots
Learners review the concept of median, explore how to calculate quartiles for any size data set and experience how to build a box plot.
Curated OER
Water Usage and Conservation
Young scholars investigate water usage at school and at home. They use graphs and tables to evaluate water usage. Students describe possible water conservation measures. They use graphs and tables to relate data as part of a written report.
