Curated OER
Cultural "I Amm" Speech Project
Eleventh graders use the internet and other sources to research a selected individual. They explore important events, challenges, and the impact and influence the person had on US History. Using the information gathered, 11th graders...
Curated OER
Creating with Alice
Students explore Alice Programming Software. In this exploratory lesson, students design a unique storyboard which will guide the creation of their Alice World. Students write and create their own films.
Curated OER
Why is there Pollution in Mexico City?
Young scholars explore the causes of air pollution in Mexico City from a holistic approach.
Curated OER
WATTS UP?
Second graders research the Internet as they classify different forms of energy, investigate electrical energy and how to conserve energy.
Curated OER
Honey ! I Blew Up The Bee!
Second graders complete a variety of bee-themed activities. They consider the importance of honeybees in food production, conduct Internet research, prepare foods using honey, complete puzzles and compile a portfolio of their work.
Curated OER
Dr. Teeth and Dr. Gums To The Rescue
Second graders role play as dentists researching teeth and their care. They create a slide show showing how a character, Bear, can take care of this teeth explaining habitats, diets and teeth.
Curated OER
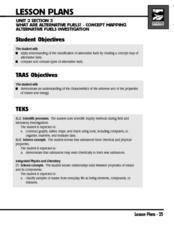
What Are Alternative Fuels? Concept Mapping Alternative Fuels Investigation
Students compare and contrast the different types of alternative fuels. They create a concept map to understand their classification. They examine the properties of matter and energy as well.
Curated OER
Cloud Shadows
Young scholars classify clouds as transparent, translucent or opaque. They conduct an experiment to determine the visual opacity of several classroom objects and then conduct further observations of clouds.
Curated OER
Comparing Ethnic Groups
Eleventh graders explore the relationship between the United States and the Native Americans from after the Civil War to the early 1900's. They evaluate the actions of the United States towards Native Americans and compare the actions to...
Curated OER
Chemical Changes by Gems
Seventh graders observe that heat is produced when two substances are combined. They brainstorm how, and then experiment to find out which of two chemicals created the heat.
Curated OER
Mechanical Energy
Students discover the difference between kinetic and potential energy in an experiment using toy cars and tracks. In small groups, they set up the experiment to determine the distance milk cartons will travel when hit by toy car. They...
Curated OER
Flame Test
Students conduct a flame test on different substances. In this chemistry lesson, students predict the element present based on the color emitted during the flame test. They explain how different elements produce different colors.
Curated OER
Geometric Figures
Students identify two and three dimensional shapes and use appropriate geometric vocabulary to write a description of the figure by taking pictures of geometric figures in their own environment.
Texas Education Agency
Texas Gateway: Graphing Data to Demonstrate Relationships
Given problem situations, the student will graph data with a constant rate of change to demonstrate relationships in familiar concepts, such as scaling.
University of Waterloo (Canada)
Wired Math: Organizing Data Grade 7 [Pdf]
A collection of worksheets that focus on data analysis and organizing data. Includes detailed examples, colorful visuals, and a link to a related game. Acrobat Reader required.
PBS
Pbs Kids Afterschool Adventure!: Operation: Data Saves the Day Activity Plan
Data comes to the rescue! Children will collect, analyze, and represent data as they try to dodge a series of catastrophes faced by characters from their favorite PBS Kids shows.
Oswego City School District
Regents Exam Prep Center: Practice With Organizing and Interpreting Data
Several problems are presented to test your skills in creating and interpreting frequency tables, pie charts, box-and-whisker and stem-and-leaf plots.
Scholastic
Scholastic: Study Jams! Math: Data Analysis: Pictograph
Watch short video clips that show step by step how to organize data and create a pictograph. Then check for understanding by testing yourself.
National Center for Ecological Analysis and Synthesis, University of California Santa Barbara
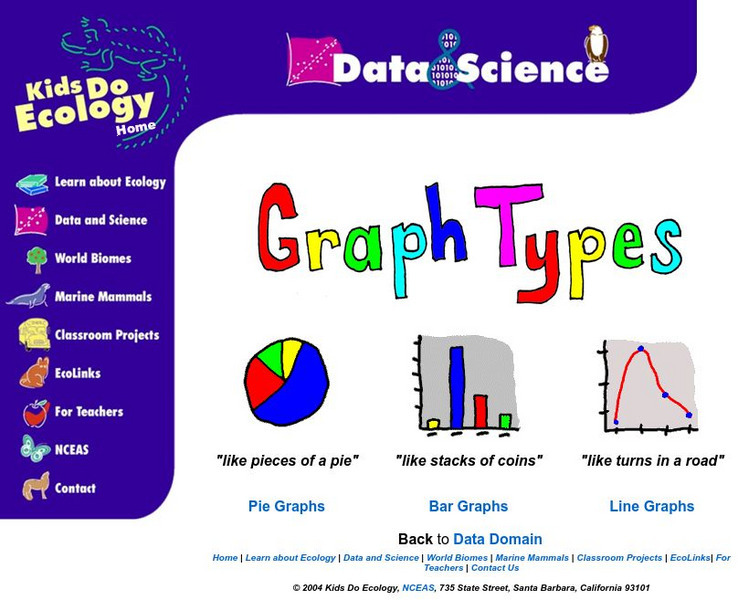
Nceas: Graph Types
At this site from NCEAS you can learn how to organize your data into pie graphs, bar graphs, and line graphs. Explanations and examples are given of each graph along with several questions that check comprehension.
Other
Clayton State: Organizing & Presenting a Frequency Dist.
The easiest method of organizing data is a frequency distribution, which converts raw data into a meaningful pattern for statistical analysis. Learn how in this tutorial with examples.
Education.com
Education.com: 1.md.c.4 Worksheets
[Free Registration/Login Required] These worksheets can help students practice organizing, representing, and interpreting data with up to three categories. Choose from among 25 worksheets based on your student's needs.
Texas Education Agency
Texas Gateway: Scientific Investigation and Reasoning Data Organization
Using interactive exercises, students will review how to construct tables and graphs in order to organize data.
NASA
Nasa: Precipitation Towers: Modeling Weather Data
This lesson uses stacking cubes as a way to graph precipitation data, comparing the precipitation averages and seasonal patterns for several locations. Variations on the lesson can accommodate various ages and ability levels. Students...
CK-12 Foundation
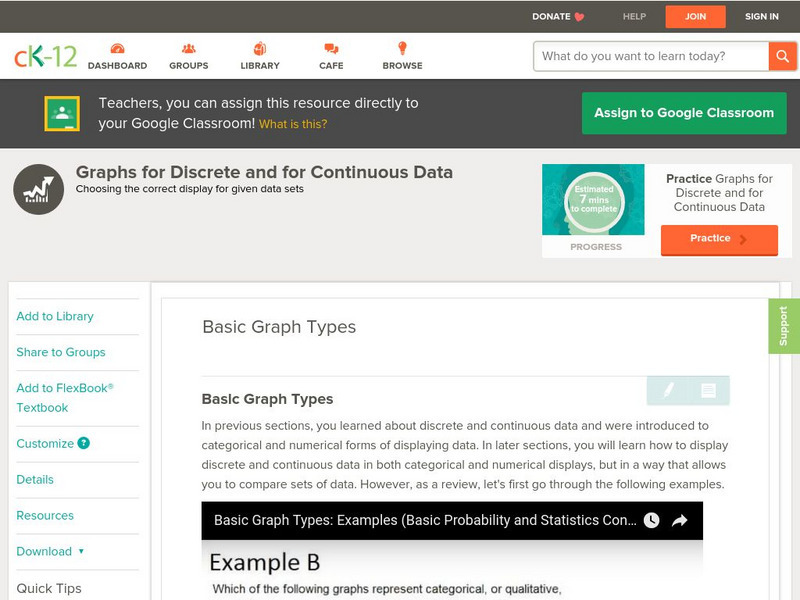
Ck 12: Statistics: Basic Graph Types
[Free Registration/Login may be required to access all resource tools.] Organize distributions of data by using a number of different methods.






![Wired Math: Organizing Data Grade 7 [Pdf] Activity Wired Math: Organizing Data Grade 7 [Pdf] Activity](https://d15y2dacu3jp90.cloudfront.net/images/attachment_defaults/resource/large/FPO-knovation.png)


