Curated OER
Survey of Height
In this data collection instructional activity, students survey the heights of their fellow classmates, organize their data in a data table, and create a bar graph from their data. Once bar graph is completed, students complete 2 short...
Curated OER
Organizing Data
In this data worksheet, students convert measurements to significant notation and determine the number of significant digits. This worksheet has 4 fill in the blank and 2 short answer questions.
Curated OER
Iron For Breakfast
Third graders are challenged to use scientific thinking, they experiment and observe which objects are attracted to a magnet. Pupils use the evidence to construct an explanation as to what common property the objects attracted to a...
Curated OER
Beans and Baleen
Predict whale populations using different beans as whales! Learners observe different types of beans in a dish knowing that each bean represents a different kind of whale. They then predict how many "whales" there are in a certain area....
Curated OER
Are We Couch Potatoes or Busy Bees? Data Analysis of Physical Activity in School
Students study practical data analysis within the constraints of the scientific method. In this data instructional activity students collect and enter data into a computer spreadsheet then create graphs.
Curated OER
Pick a Pet
Students design informational materials to educate people on the importance of matching a new pet to the family's lifestyle and living arrangements. Students use critical thinking skills to make a decision on the appropriate choice for a...
Curated OER
Sorting and Graphing Animals
Students inquire about animals using SIRS Discoverer or eLibrary Elementary. In this organizing data lesson, students sort pictures of animals in various ways and develop graphs. Students locate a mammal, reptile, fish, insect or...
Curated OER
Fast Food Survey Using Bar Graphs
Second graders create a bar graph to pictorically represent the data collected from a survey of students. They use Excel to electronically create the graphs and data tallies. They then interpret their data using sentences to explain.
Curated OER
Making a Line Graph
In this line graph worksheet, students use data given in a table and assign axes, make a scale, plot data and make a line or curve on their constructed graphs.
Curated OER
Evaluating Data
In this data worksheet, students learn how to organize the data collected during an experiment and practice finding patterns. Students graph a table of experimental data and complete 1 short answer question.
Curated OER
Using Charts, Graphs, Tables, or Charts
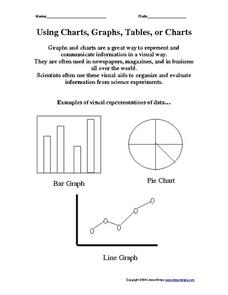
In this charts, graphs and tables activity, students view 3 different types of visual representations of data, make a list of 20 items and decide how the items can best be put together in groups to make a graph, chart or table. Students...
Curated OER
Graph and Compare the Adventure's Temperature Vs. Local Temperature
Students explore the concept graphing data. For this graphing data lesson, students use weather data from their local weather and some other city and graph them. Students plot the local weather vs. another city. Students record...
Curated OER
Using Your Marbles - Volume Measurement and Reporting
Demonstrate how to measure the volume of liquids and solids immersed in liquid to your class. They observe a teacher-led demonstration, and in small groups construct a data table that demonstrates how many marbles were used and the...
Curated OER
Environmental Agents of Mathematics: Mathematics for Change
High schoolers analyze environmental science data using Math. They do research about renewable energy, gather data, create graphs and interpret their findings. Then the group presents their arguments persuasively using their findings to...
Curated OER
Physical Science: Festival of Bubbles
Investigate bubbles through the use of scientific inquiry. Pupils blow bubbles using several methods and measure the resulting bubble print. Measurements are recorded on a data table and transferred to a bar graph. Results are discussed...
Curated OER
Parachute Drop
Learners will have fun creating a parachute to collect data with. They will construct the parachute in small groups, measure the materials, and create an observation sheet. Then they drop the parachute and make predictions about how long...
Curated OER
Trash to Gas
Middle schoolers experiment with biomass materials as alternative energy sources. In this biomass material lesson plan, students participate in an experiment with cow manure to determine how it can be used as an energy source. They...
Curated OER
Acid-Base Titration
Students determine the concentration of an unknown solution. This task assesses students' abilities to state hypothesis, develop procedures for investigation, plan for recording and organizing observations and data, collect data, create...
Curated OER
Graphing and Analyzing Biome Data
Students explore biome data. In this world geography and weather data analysis lesson, students record data about weather conditions in North Carolina, Las Vegas, and Brazil. Students convert Fahrenheit degrees to Celsius degrees and use...
Curated OER
How Creepy!
Young scholars observe and measure a model of slow down slope movement. In this graphing lesson students collect, record, and organize data that apply to models.
University of Georgia
Endothermic and Exothermic Reactions
Equip your chemistry class with the tools to properly understand endothermic and exothermic reactions. Young chemists collect, analyze, and graph data to determine how the Law of Conservation of Matter is applied to chemical...
Curated OER
Tulip Graphing
Students create a graph of tulip growth. In this data analysis lesson, students plant tulip bulbs and use graph paper to begin graphing data on the growth of the tulip.
Curated OER
Comparing Temperatures and Latitudes
Eighth graders collect weather data from a variety of cities at the same latitudes, but on different continents. They organize data using spreadsheet program, generate graphs, and incorporate into a word processing document. Students...
Curated OER
Curious Clouds
Second graders explore clouds. They read The Cloud Book by Tomie dePola. Students sort the cloud pictures into three categories. Students create a graph using the cloud pictures. They use Excel to create a bar graph.


