Illustrative Mathematics
Growing Bean Plants (Grade 2)
After planting a bean seed in a jar, young scientists observe the growth patterns over several days. As the bean becomes a sprout, and the sprout becomes a plant, partners measure and plot the data. They notice patterns, practice...
National Council of Teachers of Mathematics
Eruptions: Old Faithful Geyser
How long do we have to wait? Given several days of times between eruptions of Old Faithful, learners create a graphical representation for two days. Groups combine their data to determine an appropriate wait time between eruptions.
US Department of Commerce
How Does Our Class Compare?
Compare the class to the country. As a group, pupils collect data on the types of activities boys and girls do after school. Learners compare the number of girls to the number of boys for each activity. Using census data, individuals...
Curated OER
Button Bonanza
Collections of data represented in stem and leaf plots are organized by young statisticians as they embark some math engaging activities.
US Department of Commerce
Applying Correlation Coefficients - Educational Attainment and Unemployment
Correlate education with unemployment rates. Individuals compare state and regional unemployment rates with education levels by calculating the correlation coefficient and analyzing scatter plots. Pupils begin by looking at regional data...
101 Questions
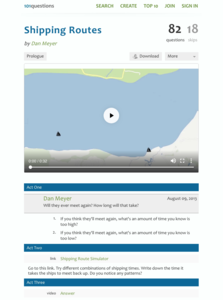
Shipping Routes
The product of the hard work is learning. Scholars use a simulation tool to collect information to analyze. They must decide when two ships traveling back and forth across a river at different rates will meet on the same side. The intent...
Howard Hughes Medical Institute
Building Ecological Pyramids
Looking for a fresh take on traditional food/energy pyramids? Conduct an innovative activity where pupils build their own! The lesson uses research data from Gorongosa National Park in Mozambique for a real-life safari touch. Scholars...
US Department of Commerce
Diversity: Languages Spoken in the United States
High schoolers begin a discussion on diversity and determine the percent of the population that speak another language at home in the US. Classmates make a prediction of the percentage of people that speak another language at home in...
GLOBE Program
Calculating Relative Air Mass
Combine math and science with fun in the sun! Scientists build a solar gnomon using reusable materials to calculate relative air mass. Mathematicians measure the pole's shadow and use the data to solve for relative air mass....
Illustrative Mathematics
Speed Trap
In which direction is traffic moving faster, north or south? Use box and whisker plots to organize data and interpret the results. Detailed solutions are included. This activity would be good as a warm up or quick assessment at the...
101 Questions
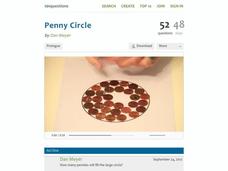
Penny Circle
Watch as your classes buy into a rich lesson full of information. A video opener challenges individuals to determine the number of pennies that fit in a circle with a 22-inch diameter. Using lesson materials, scholars collect data and...
PBL Pathways
Medical Insurance 2
Make an informed decision when choosing a medical insurance provider. An engaging lesson asks your classes to write piecewise models to represent the cost of different medical plans. The project-based learning activity is a variation of...
Teach Engineering
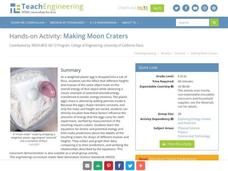
Making Moon Craters
Create an egg-citing study of energy. Pupils investigate the effect of height and mass on the overall amount of energy of a falling object. The fourth segment in a six-part series on energy uses a weighted egg falling from different...
Illustrative Mathematics
Heads or Tails
Heads! A great way to practice probability is to flip a coin in class. The provided data allows your mathematicians to predict the probability of heads in ten coin flips. Bring coins to class and allow your own trial of heads or tails....
Howard Hughes Medical Institute
Spreadsheet Tutorial 1: Formulae, Functions, and Averages
Spread your knowledge of spreadsheets. The first of five tutorials in the Spreadsheet Data Analysis unit introduces the basics of spreadsheets. It shows future data analysts how to organize and format tables, and how to use functions to...
NASA
Roving on the Moon
Build a rover for pennies in a fun-filled activity! Young engineers design, build, test, and evaluate a lunar rover model. Using rubber bands, plastic straws, and cardboard, teams collaborate to make a rover model with spinning wheels....
Illustrative Mathematics
How Many Buttons?
Bring the class into the probability by having everyone count buttons on their shirts. Organize the data into the chart provided and chose different possibilities such as "female with one button" or "all students with more than four...
101 Questions
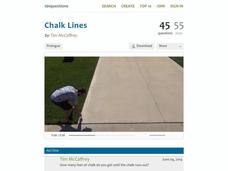
Chalk Lines
Read between the lines to find a solution. Budding mathematicians analyze a situation to solve a problem. They view a video presentation of the problem, brainstorm important information to gather, and write linear equations to find...
Illustrative Mathematics
Electoral College
A cross-curricular resource that takes the electoral votes and allows your learners to organize and analyze the data. Young voters can determine which states are more influential and interpret the dotplot provided for more data....
Illustrative Mathematics
Puppy Weights
Nobody can say no to puppies, so lets use them in math! Your learners will take puppy birth weights and organize them into different graphs. They can do a variety of different graphs and detail into the problem based on your classroom...
Teach Engineering
Lighting in My Classroom Survey
How much energy does it take to light a room? Class members calculate the total wattage it takes to light the classroom. Through calculations, responsible scientists determine the cost of energy for the year, then figure out...
University of Waikato
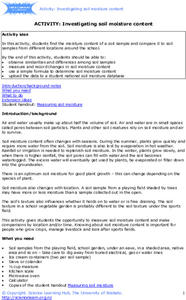
Investigating Soil Moisture Content
Class members analyze the water content in soil samples by drying out the samples and taking measurements every minute until all the moisture is gone. Scholars compare the initial weight to the dried weight to calculate the percentage of...
It's About Time
Conservation of Momentum
Assist your class with understanding collisions as they apply the Law of Conservation of Momentum. Pupils measure the momentum before and after manipulation of two objects so that one strikes another in an inelastic collision. The lesson...
It's About Time
Identifying Matter
High schoolers test wood splints that have been soaked in mystery solutions to identify the different colors it produces when lit. The lesson concludes with a reading passage and analysis questions.


