Hi, what do you want to do?
Curated OER
Hooke's Law
Students explore the relationship between the force applied to a spring and its stretch. They design and conduct an experiment to determine the stretch of spring with 15N of force without having an actual 15N mass.
Curated OER
Graphing Our Favorite Candy Bars
Students use ClarisWorks to graph class' favorite candy bars on a bar graph.
Curated OER
Map Creation
Second graders identify a map, symbol, key, and compass rose. Students create and print a map for teacher evaluation using the computer. Students identify the symbols on their map and orally present them to the class.
Curated OER
Shells and Subshells
Learners explore how to show evidence of subshells and electron filling on the visual scale. They examine subshell filling and evaluate unknowns based on the atomic emission spectrum. Students design an experiment to identify colors of...
Curated OER
Supermarket Smarts
Pupils examine how a consumer can make informed choices. They visit stores with a prepared shopping list, record the prices on a spreadsheet, create graphs, and create a Powerpoint presentation comparing the total cost of stores and a...
Curated OER
Hyped Up Over North Carolina Symbols
Fourth graders obtain knowledge of North Carolina symbols and create a multimedia presentation to be presented to the class.
Curated OER
Researching Famous People
Student take notes, on a graphic organizer, about the life of a famous person. They create a trading card about their famous person including a portrait and important facts.
Curated OER
Owning a Pet
Fourth graders identify and use different forms of writing for various purposes. Using the internet, they read and gather information and write quesitons for their own investigations on the various pets they could own. They practice...
Curated OER
Fun With Graphs
First graders read about making graphs and lean how to make graphs using "The Graph Club" software.
Curated OER
The Nesting Habits of Folders
Students create an organized web of nested grade level folers. Within each grade level folder, they create a Language Arts/Social Studies folder and a Math/Science folder. All folders be color coded.
Curated OER
Watershed Management
Students investigate the concept of a watershed. They conduct research into the concept using a variety of resources. Students take a field trip to a local watershed to make observations. The outcome is a report concerning the outside...
Curated OER
Bears
Students complete a variety of bear-related activities. They sort and graph teddy bears, distinguish between real and non-real bears and research bear life cycles and habitats.
Curated OER
Lewis and Clark Encounters with Native Americans
Students research what the exchange was between the various Native American groups and Lewis and Clark. They are able to write reflections after truly considering the issue with the help of research.
Curated OER
Career Exploration
Fifth graders identify areas of careers that coincide with their individual interests.
Curated OER
Rocks and Minerals Composition Database
Fourth graders research a specific rock or mineral. They compile the facts into a database which students access for information.
University of Texas
Inside Mathematics: Parking Cars [Pdf]
This task challenges a student to use their understanding of scale to read and interpret data in a bar graph.
University of Texas
Inside Mathematics: Our Pets [Pdf]
This task challenges a student to demonstrate understanding of concepts involved in representing and interpreting data.
Google
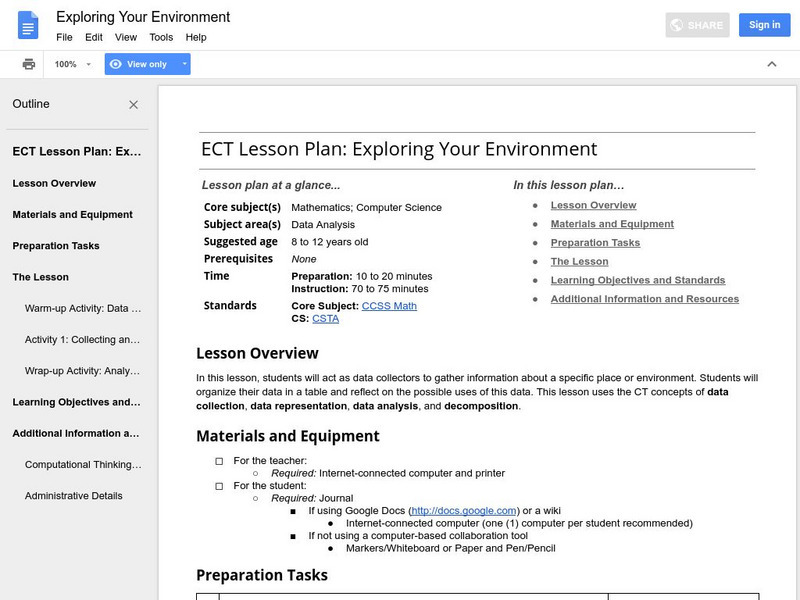
Google for Education: Exploring Your Environment
Learners act as data collectors who gather different types of information about various things in the environment. Students then organize the data in a table and reflect on the possible uses of this data.
Alabama Learning Exchange
Alex: Get on Your Mark, Get Set, Go!
In collaborative/cooperative groups, students will review basic vocabulary and concepts for data and statistics. Students will create, collect, display, and interpret data in the form of frequency tables, bar graphs and circle graphs.
Other
Nearpod: Displaying Data: Dot Plots
For this lesson, learners will learn how to create and intrepret dot plots.
University of Texas at Austin
Mathematics Teks Toolkit: The Sounds of Music
In this lesson, students collect data, graph it, then determine the period and frequency of the sound waves made by a guitar.
Alabama Learning Exchange
Alex: Heads Up!
The lesson is a hands-on project. Students will work in pairs to gather various measurements, organizing the data into a provided chart. The measurements will be used to review, reinforce, and introduce skills such as measures of central...
Alabama Learning Exchange
Alex: Getting to Know Your Classmates Using Bar Graphs
Young scholars will collect data from class using surveys. Students survey classmates concerning favorite movies, favorite color, shoe size, time spent studying, brand of cell phone and etc. From the data they will create bar graphs...


![Inside Mathematics: Parking Cars [Pdf] Lesson Plan Inside Mathematics: Parking Cars [Pdf] Lesson Plan](https://static.lp.lexp.cloud/images/attachment_defaults/resource/large/FPO-knovation.png)


