Hi, what do you want to do?
Curated OER
Rocks and Minerals Composition Database
Fourth graders research a specific rock or mineral. They compile the facts into a database which students access for information.
Texas Education Agency
Texas Gateway: Scientific Investigation and Reasoning Data Organization
Using interactive exercises, students will review how to construct tables and graphs in order to organize data.
Oswego City School District
Regents Exam Prep Center: Displaying Data
Use this lesson, practice exercise, and teacher resource in planning instruction on displaying data. In the lessons, you'll find definitions and examples of ways to collect and organize data, quartiles, and box-and-whisker plots, as well...
National Council of Teachers of Mathematics
Nctm: Illuminations: State Data Map
Data can be displayed in a variety of ways. This interactive map of the United States shows data by degrees of color. Choose to display data such as: land area, population, population density, gas use, and much more.
Yale University
Yale University: Categorical Data Examples
Site provides some different examples of categorical data and discusses the use of two-way tables.
E-learning for Kids
E Learning for Kids: Math: Tea Store: Data and Graphs
Play games by exploring how to interpret bar graphs and organize data in a table.
University of Texas
Inside Mathematics: Parking Cars [Pdf]
This task challenges a student to use their understanding of scale to read and interpret data in a bar graph.
Other
Pre K Pages: Question of the Day Graphing Activities for Preschool, Pre K, and K
A question of the day is a graphing activity that can be used to teach young children in preschool or kindergarten how to collect and organize data in a graphic representation as well as teach them how to analyze the data. This site...
University of Texas
Inside Mathematics: Our Pets [Pdf]
This task challenges a student to demonstrate understanding of concepts involved in representing and interpreting data.
Other
Brebeuf Jesuit Preparatory School: The Scientific Method (Part 3) [Pdf]
Explains how to collect and organize data for an experiment. Describes how to make a table and graph the data, and when to use different types of graphs. Next, it discusses which variable should be on the x- or y-axis of a graph, and how...
Oswego City School District
Regents Exam Prep Center: Practice With Organizing and Interpreting Data
Several problems are presented to test your skills in creating and interpreting frequency tables, pie charts, box-and-whisker and stem-and-leaf plots.
Cuemath
Cuemath: Data Handling
This comprehensive guide about data handling helps with understanding how the study of data handling and graphical representation of the data along with other tools help us in dealing with numerical data. Includes solved examples and...
E-learning for Kids
E Learning for Kids: Math: Rice Field: Data and Length
On this interactive website students practice various math skills using a real life scenario of a rice field. Those skills include understanding information displayed in column graphs, collecting data to answer a question, and measuring...
National Council of Teachers of Mathematics
Nctm: Figure This: Do Women Live Longer Than Men?
Use this site to figure out if women really do live longer than men. A math challenge taken from today's health journals that explores data collection, data analysis, patterns, and graphing skills. Learn how mastering these skills can be...
Sophia Learning
Sophia: Using Graphs to Analyze Data
This lesson will demonstrate how to analyze and interpret data given in the form of a graph.
E-learning for Kids
E Learning for Kids: Math: Music, Dance Performance: Chance & Data
Nadir and his family play in a band. Can you help him get all the instruments together? In these activities, students will write data using symbols, use one object to represent one item, create a column graph, and determine whether...
Texas Education Agency
Texas Gateway: Graphing Data to Demonstrate Relationships
Given problem situations, the student will graph data with a constant rate of change to demonstrate relationships in familiar concepts, such as scaling.
TED Talks
Ted: Ted Ed: Hans Rosling Shows the Best Stats You've Ever Seen
Explore collected data in regards to life expectancies, family size, and finances through out the world and the various ways the data has been displayed.
Math Is Fun
Math Is Fun: Cumulative Tables and Graphs
Explains, with examples, how values can "accumulate" in tables and graphs. Includes ten practice questions.
Google
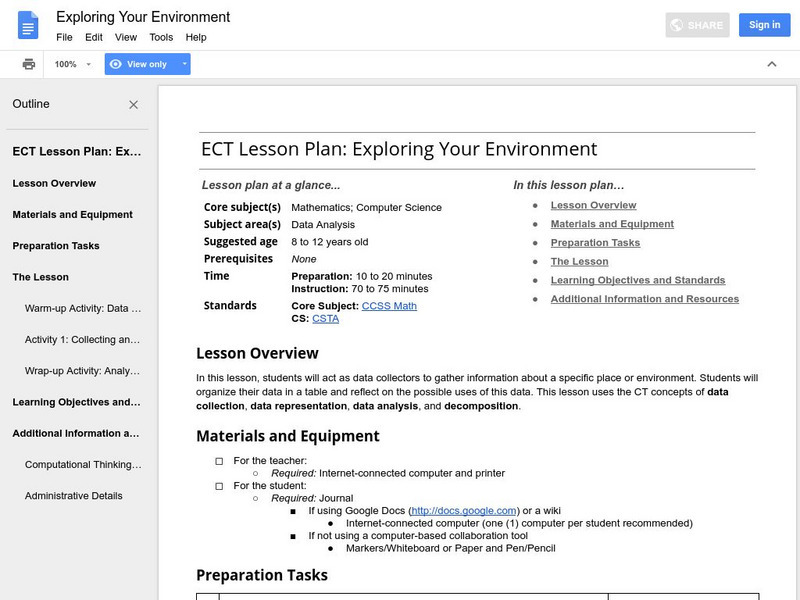
Google for Education: Exploring Your Environment
Students act as data collectors who gather different types of information about various things in the environment. Students then organize the data in a table and reflect on the possible uses of this data.
National Council of Teachers of Mathematics
Nctm: Figure This: Does It Make a Difference Where You Shop?
A math investigation that uses scatter plots to compare prices of favorite soft drinks. Discover how valuable your skills in organizing and displaying data can be in real life scenarios.
Texas Instruments
Texas Instruments: Gemini Candy
In this activity, students work in groups to collect data and draw conclusions from random samples simulated by drawing tiles from a bag. They represent the data collected in the form of a triple bar graph.
Rice University
Rice University: Cynthia Lanius: Fun and Sun Rent a Car
A wide range of math skills is incorporated into a lesson that involves planning a family's vacation to Florida. Travel expenses are gathered and compared, graphed, and analyzed in hopes of finding the best prices. There are extension...
University of Cambridge
University of Cambridge: Maths and Sports: Our Sports
What events are there in your school sports day, and in the Olympic Games? What are your favourite races and sports? This activity encourages discussion and decisions about how to collect and display data, and is designed to be...


![Inside Mathematics: Parking Cars [Pdf] Lesson Plan Inside Mathematics: Parking Cars [Pdf] Lesson Plan](https://static.lp.lexp.cloud/images/attachment_defaults/resource/large/FPO-knovation.png)


