US Department of Commerce
Commuting to Work: Box Plots, Central Tendency, Outliers
Biking may be an outlier. Using data from 10 states on the number of people reporting they bike to work, pupils calculate the measures of center. Scholars determine the range and interquartile range and find which provides a better...
US Department of Commerce
Does the Percentage of People Who Walk to Work in Cities Vary with Population Size?
To walk or not to walk? Pupils create box plots comparing the percentage of residents who walk to work in large, medium, and small cities. Using the box plots, class members compare the data that reflects available statistics. Scholars...
Illustrative Mathematics
Speed Trap
In which direction is traffic moving faster, north or south? Use box and whisker plots to organize data and interpret the results. Detailed solutions are included. This activity would be good as a warm up or quick assessment at the...
Shodor Education Foundation
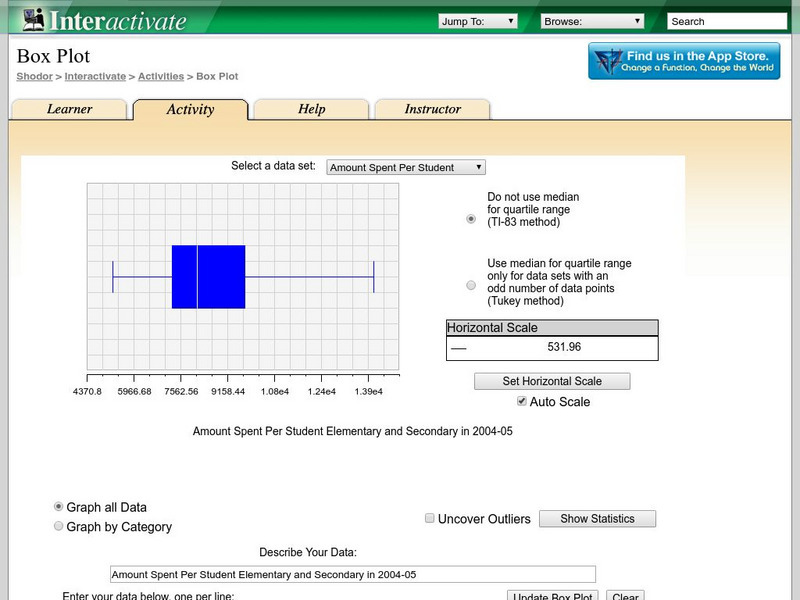
Shodor Interactivate: Box Plot
Students learn about box-and-whisker plots. The interactive box plot allows the user to explore maximum, minimum, median, upper quartile, lower quartile, and outliers.
Texas Instruments
Texas Instruments: Numb3 Rs: "Take Out" Outliers
Based off of the hit television show NUMB3RS, this lesson has students create box-and-whisker plots for given data, and then determine which (if any) data points are outliers. Students determine outliers through two methods in this...
Texas Instruments
Texas Instruments: Survey Project
Students survey other students (numerical and non numerical data) and calculate measures of central tendency (if possible) of data and make regular box-an-whisker plots and outlier box-and-whisker plots to analyze the data.


