Balanced Assessment
Movie Survey
Movie preferences will get your classes talking! Individuals read a pie graph and construct a bar graph using the same information. They then answer questions specific to the data and sample size.
Virginia Department of Education
Graphs
Examine different types of graphs as a means for analyzing data. Math scholars identify the type of graph from a series of data displays and then develop questions to match each one. Then, given a scatter plot of height versus age...
Virginia Department of Education
May I Have Fries with That?
Not all pie graphs are about pies. The class conducts a survey on favorite fast food categories in a lesson on data representation. Pupils use the results to create a circle graph.
Curated OER
Data Handling
In this data handling worksheet, students interpret data found in table, graphs and charts. They organize data and draw bar charts. This two-page worksheet contains 2 multi-step problems.
Curated OER
Data Handling
In this data handling worksheet, 6th graders solve and complete 4 various types of problems. First, they draw a bar chart to represent the information provided in the table shown. Then, students show beneath the table how to work out the...
Curated OER
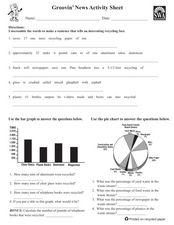
Groovin' News Activity Sheet
In these recycling worksheets, students complete several activities to learn about recycling. Students complete a word search, word scramble, bar graph, pie chart, research project, class project, and individual project for recycling.
Curated OER
Equal Parts
In this equal parts worksheet, students, working with a partner, study, formulate and calculate the answers to six word problems or drawings.
Curated OER
Recycling Statistics
In this environment worksheet, students look for the answers to the environmental impact of recycling in Great Britain with the statistics from the pie graph.
Curated OER
Thinking About Technology: What Is It? How Can It Help Us?
What is technology and how can it help us? Using a worksheet, students read a list and choose practical applications of scientific knowledge, brainstorm examples of home, school and hospital technology, graph answers in a pie chart, and...
Curated OER
Fourth Grade Science
In this science worksheet, 4th graders answer multiple choice questions about natural objects, rainfall, the solar system, and more. Students complete 25 questions.
Curated OER
Pond Theme Unit
In this pond theme activity students research facts on pond life. Students complete comprehension questions, crosswords, word search, and math puzzles. Students write a short report.
Curated OER
Informational Reading: Electronics Are Made from Resources
For this comprehension worksheet, learners read about the making of a computer: circuit boards, hard drives, monitors and plastic housings. Students then answer 3 multiples choice questions.
Curated OER
Technology has a Solution!
In this technology instructional activity, students summarize four things they learned about technology and the environment. Students then write a report that outlines how technology is solving environmental issues.
Curated OER
A Look at the Life That Electronics Lead
In this comprehension worksheet, students fill in ways on a graphic organizer that people or companies can conserve energy, reduce waste or minimize the impact to the environment. Next, students solve 3 "environmental" math word problems.


