Curated OER
Statistics: Reading and interpreting production graphs
Students interpret and create different types of graphs. They analyze data from charts, develop a survey and design appropriate graphic illustrations and make a presentation.
Curated OER
"Math Curse" by Jon Scieszka
Students explain everyday uses of numbers and relationships of numbers.
Curated OER
Furnishing an Apartment
Students explore the components that comprise the formation of a budget. Sales brochures advertising apartment furnishings are used to assist students in this task.
Curated OER
The Stock Market Game
Students explore the stock market. They choose a company and research the company's financial report. Students select 4-10 stocks and become an advocate for one stock. Using spreadsheet software, students compare stocks. They analyze...
Curated OER
Pumpkin Seed Experiment
In this unique lesson students participate in a pumpkin seed experiment. Students interact with the pumpkins weight, seeds and record their findings of what lies within the pumpkin once the top of the pumpkin is cut off for observations....
Curated OER
Can I Afford This Apartment?
Students explore the concept of cost of living. In this cost of living lesson, students calculate the cost of living in an apartment along with other living expenses.
Curated OER
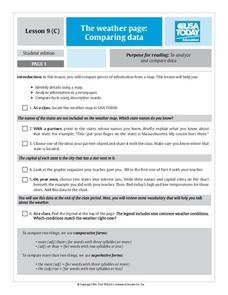
The Weather Page: Comparing Data
Students analyze data from maps. For this comparing data lesson, students use comparative and superlative statements to draw comparisons among the weather in different American cities based on USA Today weather maps.
Curated OER
Are Taxes "Normal?"
Students explore the concept of normal distribution. For this normal distribution lesson, students find the normal distribution of taxes in the 50 US states. Students make histograms, frequency tables, and find the mean and median of tax...
Curated OER
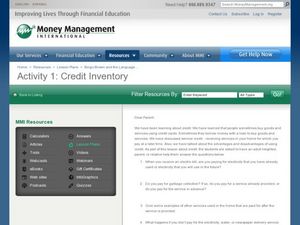
Credit Inventory
In this money management worksheet, students read a paragraph regarding credit and then respond to 6 short answer questions regarding credit.
Curated OER
Thanksgiving Dinner
Students plan a traditional Thanksgiving dinner. In this Thanksgiving lesson, students compare and contrast the first Thanksgiving to Thanksgiving celebrations today. Students plan a traditional Thanksgiving dinner and research the costs...
Curated OER
New York State Testing Program: Mathematics-Grade 4
In this New York testing program worksheet, 4th graders complete a total of 39 problems that cover a wide variety of 4th grade math concepts.
Curated OER
Petroglyphs and Pictographs
Fourth graders make necklaces out of petroglyphs that they stamp into clay. In this petroglyphs lesson plan, 4th graders draw designs and explain where they come from as well.
Curated OER
Temperature Bar Graph
Students explore mean, median and mode. For this math lesson, students analyze temperature data and figure the mean, median, and mode of the data. Students graph the data in a bar graph.
Curated OER
Term Deposits: Worth the Wait?
Students study term deposits and the attributes of long and short-term savings. They examine their spending habits while looking at how different types of accounts meet different economic goals. They complete worksheets that are provided...
Curated OER
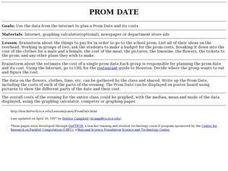
Prom Date
Students use the internet to research the cost of going to the school prom. As a class, they brainstorm about the things needed in order to go to the dance and use advertisements to make a budget. After all of the data is collected,...
Curated OER
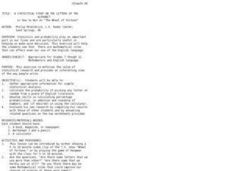
A Statistical Study on the Letters of the Alphabet
Students use a book or magazine to research the use of letters. They complete a worksheet and compare their results.
Curated OER
A Statistical Study on the Letters of the Alphabet
Young scholars see that there are mathematical rules that can affect our use of the English language. Calculate the probability of picking any letter at random from a piece of English literature.
Curated OER
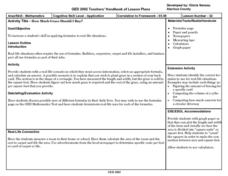
How Much Grass Should I Buy?
Students examine a variety of real life situations in which they must access information, select an appropriate formula, and calculate an answer. A rectangular piece of grass provides an opportunity for the exploration of this lesson.
Curated OER
How Can You Detect the Invisible?
Students participate in a lab activity in which they examine the characteristics of radon. They identify radon's link to cases of lung cancer. They complete a radon fact sheet and answer questions to end the lesson.
Curated OER
Statistics and Probility
Seventh graders collect data and make predictions. In this geometry lesson, 7th graders work in tiers collecting data and plotting it. They make inferences and predictions about their collected data.
Curated OER
How are Things Lining Up
In this consumer math learning exercise, students use the web to research and select a stock to buy. Students track and graph the stock’s activity over a two week period. The one page learning exercise contains a blank graph and four...


