Other
Ocean Tracks: Fact or Artifact? Interpreting Patterns in Ocean Tracks Data [Pdf]
Ever wonder where marine animals go? How fast they swim? How deep they dive? Electronic tagging has opened a new window into the world of the open ocean. Ocean Tracks gives you access to data collected by tags on real live migrating...
Texas Education Agency
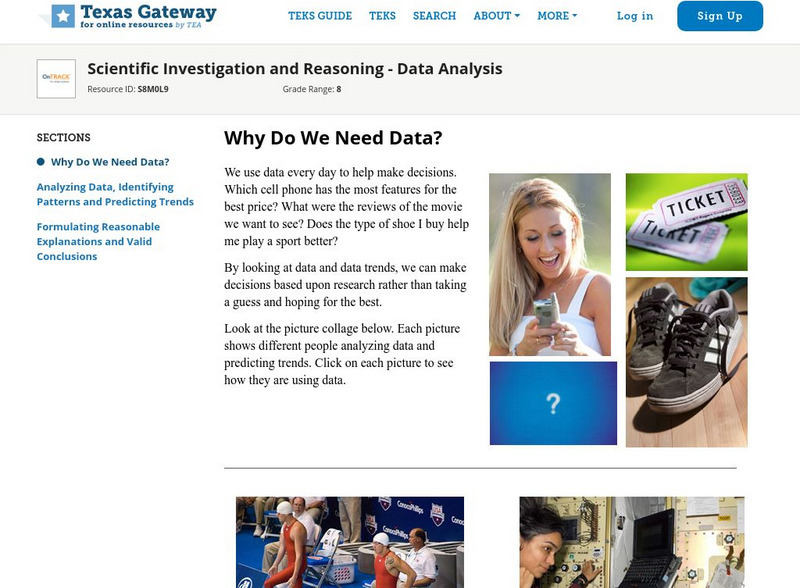
Texas Gateway: Why Do We Need Data?
We use data every day to help make decisions. Which cell phone has the most features for the best price? What were the reviews of the movie we want to see? Does the type of shoe I buy help me play a sport better?By looking at data and...
National Council of Teachers of Mathematics
The Math Forum: Growth Creature Lab Data Collecting
Lesson plan completely explains how learners will collect data on the growth of an "alligator" and determine the relationship of the growth data to the Fundamental Theorem of Similarity and to topics in geometry in general. All of the...
Google
Google for Education: Sorting Data
In this example students use data collected from their class and learn to sort it before calculating the mean, median, and mode. Additionally, students learn how to use spreadsheet functions to sort based on different criteria, leading...
Google
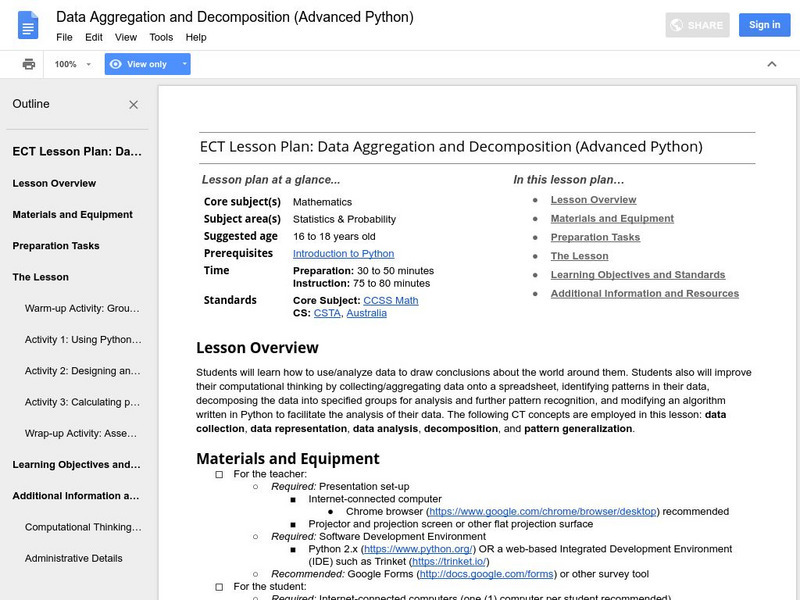
Google for Education: Data Aggregation and Decomposition (Python)
Students learn how to use and analyze data to draw conclusions about information collected from classmates. Then they use computational thinking by collecting and aggregating data onto a spreadsheet, identifying patterns in their data,...
Google
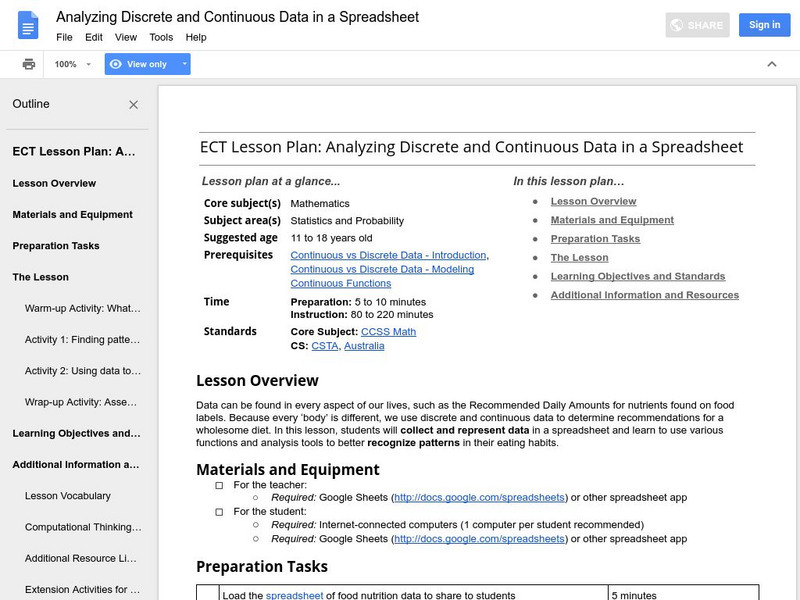
Google for Education: Applyng Discrete and Continuous Data in a Spreadsheet
Young scholars collect data in a spreadsheet and learn to use various functions and analysis tools to better see patterns in their eating habits.
Other
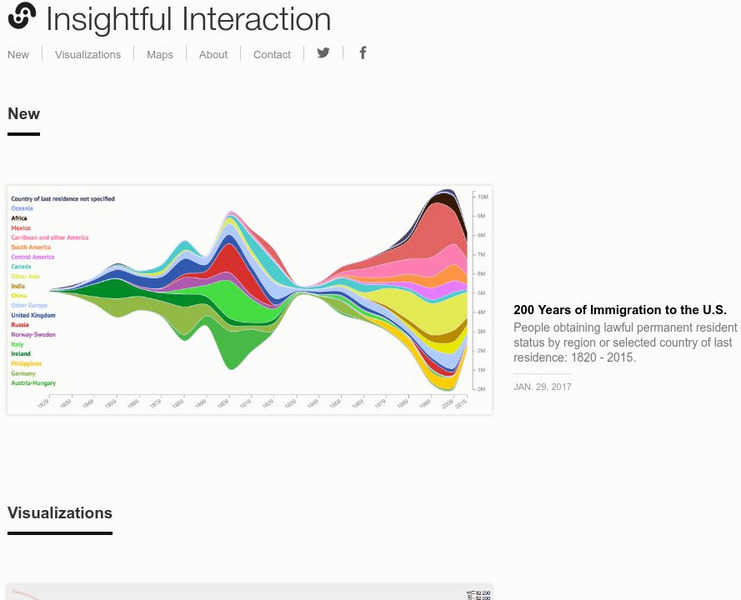
Insightful Interaction: Visualizations
A collection of interactive visualizations that were produced through analysis of economic, political, and market research data. Topics are diverse, e.g., military spending and trade, immigration, consumer spending, crime, unemployment,...
National Council of Teachers of Mathematics
Nctm: Figure This: Do Women Live Longer Than Men?
Use this site to figure out if women really do live longer than men. A math challenge taken from today's health journals that explores data collection, data analysis, patterns, and graphing skills. Learn how mastering these skills can be...
University Corporation for Atmospheric Research
Ucar: Project Sky Math
Teachers will be interested to explore the SkyMath module, and the 16 classroom activities at this site. In this program, young scholars will collect and record real-time weather data to analyze. Data analysis, graphing, number...
PBS
Pbs Mathline Lesson Plan: Struts'n Stuff [Pdf]
Incorporating concepts in algebra, number sense, patterning, data collection, and geometry, this lesson engages young scholars in various hands-on activities to explore the relationship between regular polygons and the number of...
Texas Instruments
Texas Instruments: Bounce Back: The Exponential Pattern of Rebound Heights
In this activity, students' will use a motion detector to collect motion data for a bouncing ball. They will then analyze the data to test the exponential model of motion.
Texas Instruments
Texas Instruments: Pass the Ball
In this activity, students use mathematics to examine patterns that occur in a specific scenario and predict future events for the scenario. Data is collected on the time it takes to pass a ball. The students plot graphs, fit the data...
PBS
Pbs Lesson Plan: Chances Are Talking Probability (Pdf) [Pdf]
An introductory lesson in probability for students in grades three to five. The concepts presented in this lesson are interwoven, over time, into a current unit of study. Kids examine closely the "language" of probability as used in...
Alabama Learning Exchange
Alex: Beep! Beep! Move Over! I Am Going to Be Late!
During this lesson, young scholars will investigate how to "clear up" the "Traffic Jam." They will be using large manipulatives (their bodies), small manipulatives (carpet squares), and technology (the Java applet) to find the...
Cyberbee
Cyberbee: Who Dunnit?
If you are a crime scene investigation (CSI) fan, then you will love this site! You get to be the detective by examining the evidence, viewing the crime scene, dusting for fingerprints, interviewing the suspects, and solving the crime.
PBS
Pbs Learning Media: Daily and Seasonal Weather: Interactive Lesson
Students investigate the relationship between daily weather and seasonal weather. Students will read about how weather data is collected, then interpret examples of weekly and monthly weather data to find seasonal patterns. Visual...
Columbia University
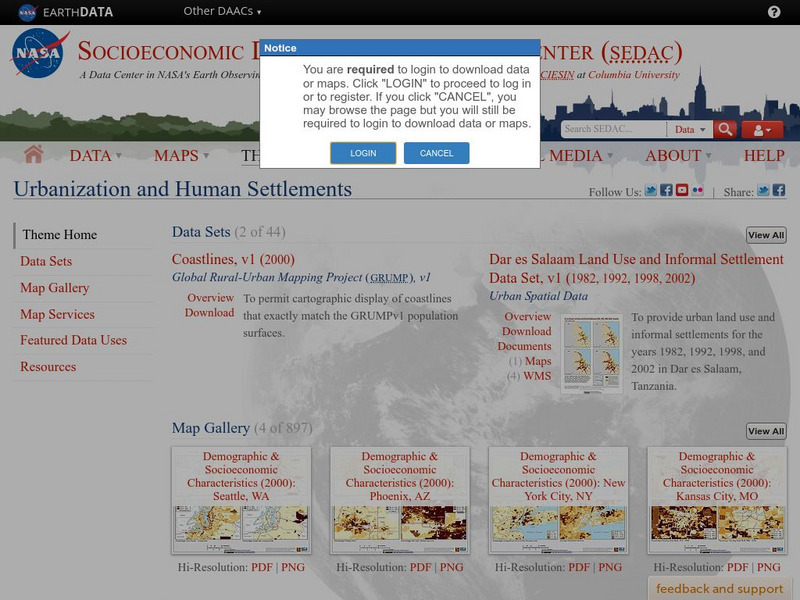
Nasa: Sedac: Urbanization and Human Settlements
[Free Registration/Login Required] A collection of twenty data sets from SEDAC (Socioeconomic Data and Applications Center) that examine urbanization in major metropolitan areas of the United States in the late 20th and the early 21st...
Other
Stat Soft: Statistics Glossary
Dozens of statistical terms are defined and illustrated in this glossary.
BBC
Bbc Bitesize: Spreadsheets
Spreadsheets are used to store information and data. Once we have our information in a spreadsheet we can run powerful calculations, make graphs and charts and analyse patterns.
Science Education Resource Center at Carleton College
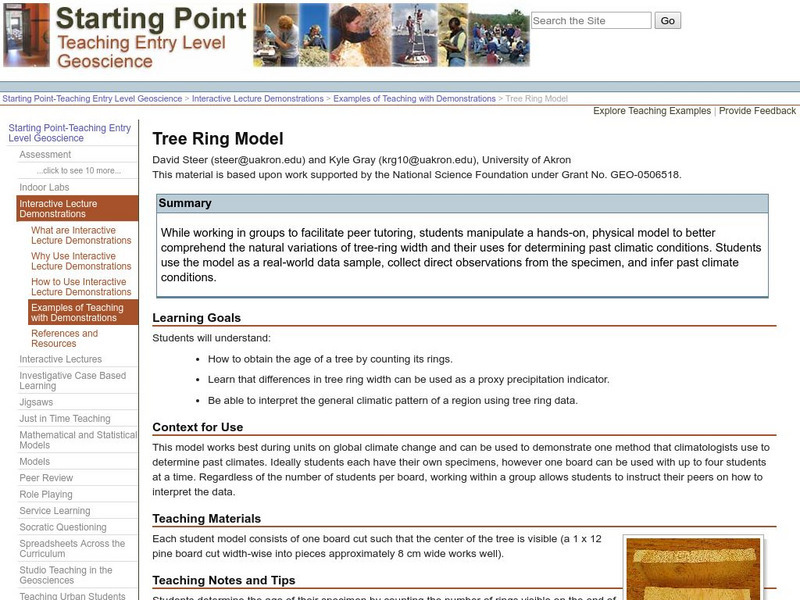
Serc: Tree Ring Model
In this instructional activity students will manipulate a hands-on, physical model to better comprehend the natural variations of tree-ring width and their uses for determining past climatic conditions. Students use the model as a...
Texas Instruments
Texas Instruments: Add Them Up
In this activity, students explore the total voltage provided by several batteries in a series to a battery-operated device. They graph scatter plots, understand multiplication as repeated addition, and use a pattern to develop a...
Texas Instruments
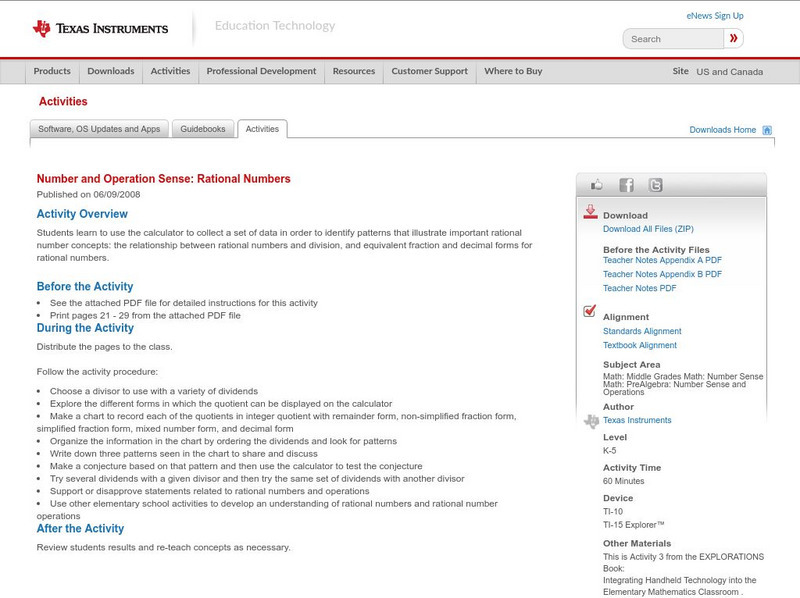
Texas Instruments: Number and Operation Sense: Rational Numbers
Students learn to use the calculator to collect a set of data in order to identify patterns that illustrate important rational number concepts: the relationship between rational numbers and division, and equivalent fraction and decimal...
Texas Instruments
Texas Instruments: Numb3 Rs: Walkabout
Based off of the hit television show NUMB3RS, this lesson has students simulate a one-dimensional random walk (by either moving up or down) and then finding patterns concerning how many "ways" a walk could end in various spots. The...
Science Education Resource Center at Carleton College
Serc: Investigating South Crow River: Discharge, Turbidity, Erosion, Sediments
In this field investigation, small groups of learners will observe and measure characteristics of the South Crow River near Mayer, Minnesota. Data collection on these characteristics will include but not be limited to: speed of current...
![Ocean Tracks: Fact or Artifact? Interpreting Patterns in Ocean Tracks Data [Pdf] Lesson Plan Ocean Tracks: Fact or Artifact? Interpreting Patterns in Ocean Tracks Data [Pdf] Lesson Plan](https://static.lp.lexp.cloud/images/attachment_defaults/resource/large/FPO-knovation.png)
