Hi, what do you want to do?
Texas Instruments
Texas Instruments: Bounce Back: The Exponential Pattern of Rebound Heights
In this activity, students' will use a motion detector to collect motion data for a bouncing ball. They will then analyze the data to test the exponential model of motion.
Texas Instruments
Texas Instruments: Pass the Ball
In this activity, students use mathematics to examine patterns that occur in a specific scenario and predict future events for the scenario. Data is collected on the time it takes to pass a ball. The students plot graphs, fit the data...
Annenberg Foundation
Annenberg Learner: Journey North: A Global Study of Wildlife Migration and Seasonal Change
Join teachers and students all over the country in observing the migratory patterns of birds and butterflies and the growth changes of plants as the climate changes. "Journey North" offers a wealth of resources to use as you investigate...
American Geosciences Institute
American Geosciences Institute: What Can Fossil Footprints Tell Us?
In this investigation, learners examine an image of multiple fossil footprint tracks. They try to construct an explanation for the events that created the pattern of tracks. Even though students come up with different explanations for...
PBS
Pbs Lesson Plan: Chances Are Talking Probability (Pdf) [Pdf]
An introductory lesson in probability for students in grades three to five. The concepts presented in this lesson are interwoven, over time, into a current unit of study. Students examine closely the "language" of probability as used in...
Alabama Learning Exchange
Alex: Beep! Beep! Move Over! I Am Going to Be Late!
During this lesson plan, young scholars will investigate how to "clear up" the "Traffic Jam." They will be using large manipulatives (their bodies), small manipulatives (carpet squares), and technology (the Java applet) to find the...
Cyberbee
Cyberbee: Who Dunnit?
If you are a crime scene investigation (CSI) fan, then you will love this site! You get to be the detective by examining the evidence, viewing the crime scene, dusting for fingerprints, interviewing the suspects, and solving the crime.
PBS
Pbs Learning Media: Daily and Seasonal Weather: Interactive Lesson
Students investigate the relationship between daily weather and seasonal weather. Students will read about how weather data is collected, then interpret examples of weekly and monthly weather data to find seasonal patterns. Visual...
Rice University
Rice University: The Hand Squeeze
Students will enjoy this data collection and class analysis experiment involving the time it takes for a hand squeeze to travel around a circle of people. From organizing the activity to collecting the data to making a table and graphing...
Columbia University
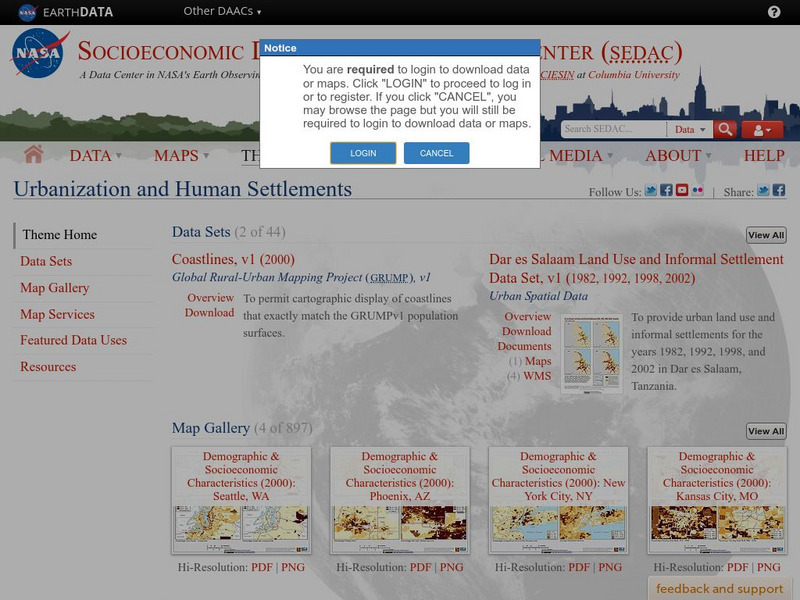
Nasa: Sedac: Urbanization and Human Settlements
[Free Registration/Login Required] A collection of twenty data sets from SEDAC (Socioeconomic Data and Applications Center) that examine urbanization in major metropolitan areas of the United States in the late 20th and the early 21st...
Math Slice
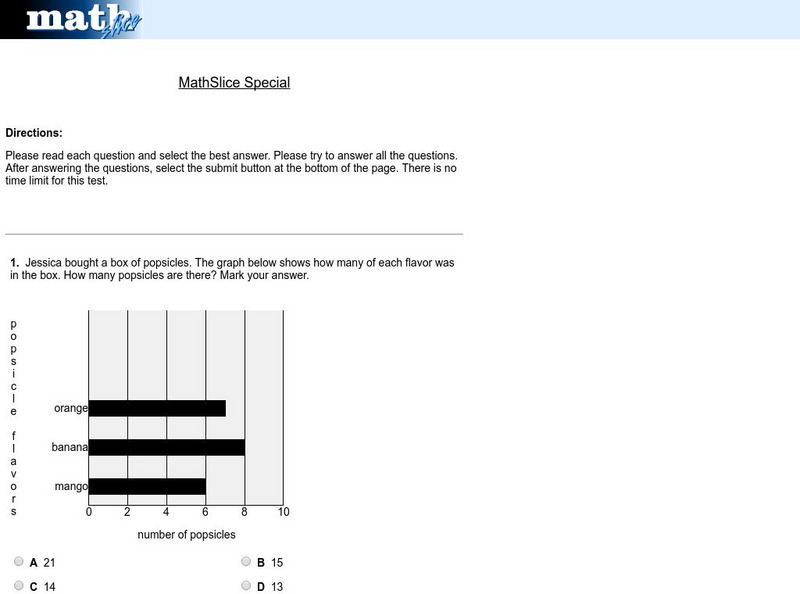
Math Slice: Chart Slice Special Test
A ten question test assessing data collection and analysis skills with bar graphs. Assessment is scored online. An excellent tool for assessment.
BSCS Science Learning
Bscs: Frog Eat Frog World
Using maps and graphs of large data sets collected in FrogWatch, middle schoolers will determine the range, preferred land cover, and proximity to water of the American bullfrog to figure out the bullfrog's requirements for food, water,...
Other
Stat Soft: Statistics Glossary
Dozens of statistical terms are defined and illustrated in this glossary.
TeachEngineering
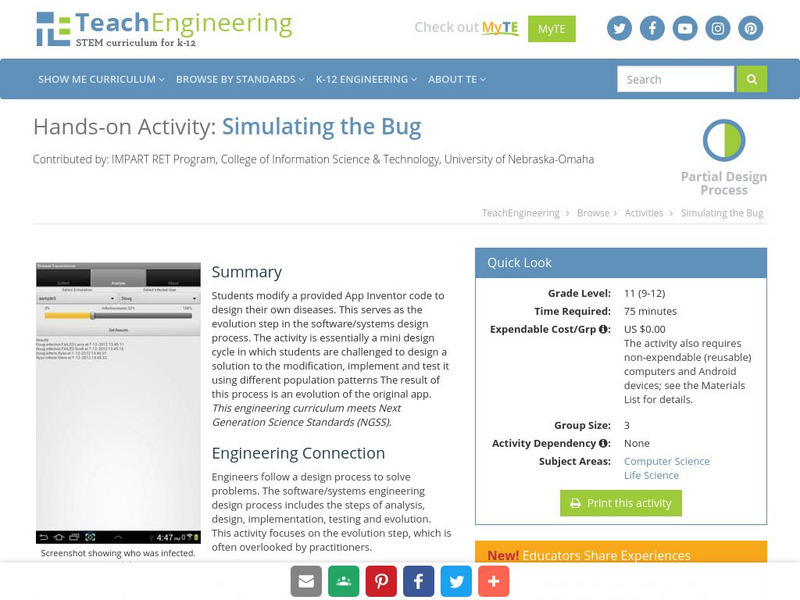
Teach Engineering: Simulating the Bug
Students modify a provided App Inventor code to design their own diseases. This serves as the evolution step in the software/systems design process. The activity is essentially a mini design cycle in which students are challenged to...
BBC
Bbc Bitesize: Spreadsheets
Spreadsheets are used to store information and data. Once we have our information in a spreadsheet we can run powerful calculations, make graphs and charts and analyse patterns.
Science Education Resource Center at Carleton College
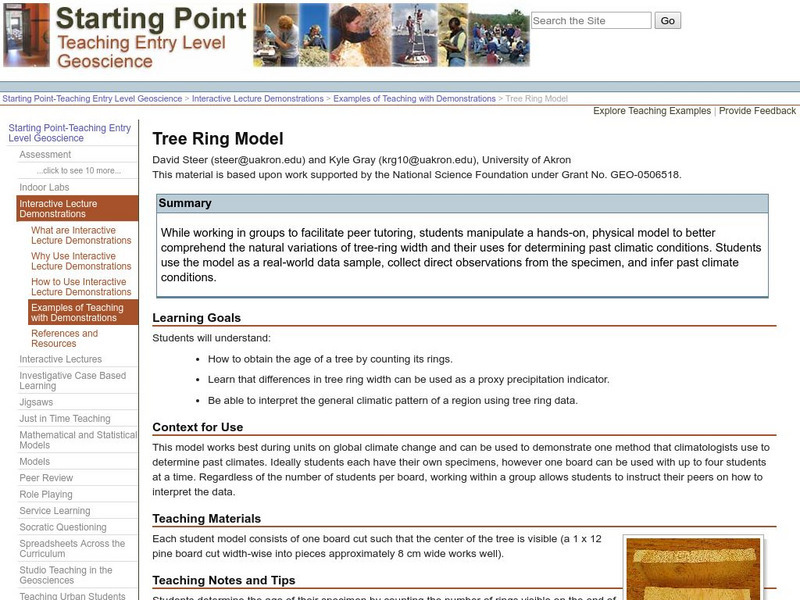
Serc: Tree Ring Model
In this lesson students will manipulate a hands-on, physical model to better comprehend the natural variations of tree-ring width and their uses for determining past climatic conditions. Students use the model as a real-world data...
Texas Instruments
Texas Instruments: Add Them Up
In this activity, students explore the total voltage provided by several batteries in a series to a battery-operated device. They graph scatter plots, understand multiplication as repeated addition, and use a pattern to develop a...
Texas Instruments
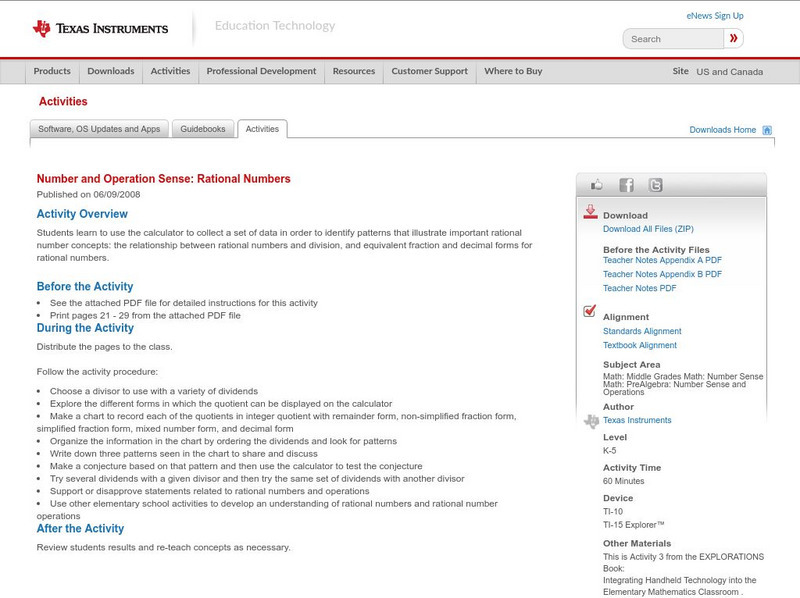
Texas Instruments: Number and Operation Sense: Rational Numbers
Students learn to use the calculator to collect a set of data in order to identify patterns that illustrate important rational number concepts: the relationship between rational numbers and division, and equivalent fraction and decimal...
Texas Instruments
Texas Instruments: Numb3 Rs: Walkabout
Based off of the hit television show NUMB3RS, this lesson has students simulate a one-dimensional random walk (by either moving up or down) and then finding patterns concerning how many "ways" a walk could end in various spots. The...
Better Lesson
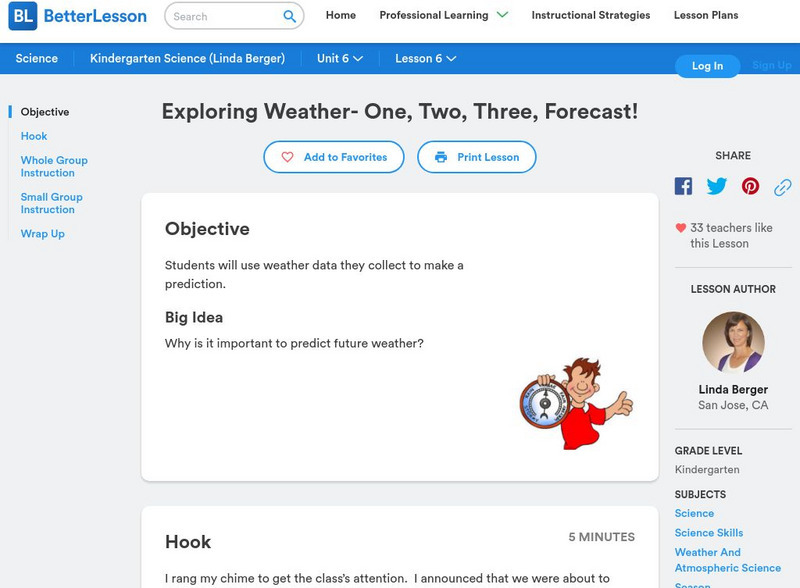
Better Lesson: Exploring Weather One, Two, Three, Forecast!
Young scholars will use weather data they collect to predict future weather. Included in this lesson are a weather forecasting recording sheet and an example of a student's completed work.
National Council of Teachers of Mathematics
Nctm: Illuminations: Handshakes
When the nine justices of the Supreme Court meet, they greet one another with a handshake to show harmony of purpose, even though their views may differ. How many handshakes occur? In general, how many handshakes occur when there are n...
Science Education Resource Center at Carleton College
Serc: Investigating South Crow River: Discharge, Turbidity, Erosion, Sediments
In this field investigation, small groups of learners will observe and measure characteristics of the South Crow River near Mayer, Minnesota. Data collection on these characteristics will include but not be limited to: speed of current...
Nature Conservancy
The Nature Conservancy: Gardens Activity Guide: Habitats
In this lesson students learn how the garden provides habitat for a variety of different animal species. They make observations and collect data to determine which species inhabit the garden. They will investigate relationships among...
TeachEngineering
Teach Engineering: Spectroscopy
Students learn how using a spectrograph helps us understand the composition of light sources. Using simple materials and holographic diffraction gratings (available online at a variety of sites, including Edmund Scientifics and the...


![Pbs Lesson Plan: Chances Are Talking Probability (Pdf) [Pdf] Unknown Type Pbs Lesson Plan: Chances Are Talking Probability (Pdf) [Pdf] Unknown Type](https://static.lp.lexp.cloud/images/attachment_defaults/resource/large/FPO-knovation.png)


