Curated OER
Stock Market Math
Students calculate commission for a stock transaction through a broker using the relationship between percentages and decimals. They decide which stocks are preferable based on the price to earnings ratios listed on the stock market quotes.
Radford University
Percentages: Lesson 1
Math can be taxing at times. With a short instructional activity, pupils determine how income tax affects take-home pay. Learners determine their net pay based on tax tables and how adjustments in their gross pay changes the paycheck.
Yummy Math
US Holiday Candy Sales
Candy is a big business! Calculate the amount of money consumers spent on major holidays—Easter, Halloween, Christmas, Hanukkah, and Valentine's Day—based on the total amount of candy sales from 2011 and the percentage of each holiday's...
Curated OER
Gold Rush California and its Diverse Population
Young scholars compare contemporary cultural differences with historical differences based on population percentage. For this cross-curriculum Gold Rush/math lesson, students analyze aspects of California's Gold Rush population and...
Curated OER
Integrating Gandhian Principles of Communal Unity in Mathematics
Fourth through sixth graders incorporate Gandhian principles into Math curriculum. They explore Gandhi's teachings on communal unity and economic equality. This has quite a bit of information about Gandhi and his observations and...
National Research Center for Career and Technical Education
Business Management and Administration: Compound Interest - A Millionaire's Best Friend
Many math concepts are covered through this resource: percentages, decimals, ratios, exponential functions, graphing, rounding, order of operations, estimation, and solving equations. Colorful worksheets and a link to a Google search for...
Curated OER
Coal Supply and Demand
A hands-on simulation perfect for an economics instructional activity, young learners investigate the availability of different sources of natural energy (coal, natural gas, oil, solar, and nuclear) and how this availability affects...
Curated OER
Motherhood Math: Mothers in the Workforce
Students evaluate a table showing how the number of working mothers increased between 1955 and 2000. They use the information from the table to complete a worksheet imbedded in this lesson plan.
Curated OER
The Stock Market
Pupils explore the loss and gain made in the stock market as they invest a sum of money and report the results as percentages instead of points.
Curated OER
Explore Surface Types on a Journey Around Earth
Students explore satellite data. In this technology cross-curriculum math and world geography instructional activity, students locate specific map areas using a microset of satellite data. Students use technology and math skills to...
Curated OER
The Demographics of Immigration: Using United States Census Data
Students work together to analyze United States Census data on immigration. They compare and contrast the data and determine how immigration numbers have changed over time. They calculate percentages and make their own conclusions...
Curated OER
The World in a Classroom
Students calculate percentages of different kinds of people in the world. For this diversity lesson plan, students will see the percentages of different people and different incomes based on if the world only had 100 people in it.
Curated OER
The Good, The Bad, The Ugly
Sixth graders examine the causes of the stock market crash of 1929. In this integrated math/history unit on the stock market, 6th graders study, research, and read stocks, visit a local bank, and create a PowerPoint to show the...
Curated OER
The Business of Interest
Students learn about finance and money management and use math to solve problems, communicate, and explore real life situations as they deal with banks. In this financial management lesson plan, students apply their math skills to real...
Curated OER
If the World Were a Village Activities
Sixth graders complete activities about the book If the World Were a Village by David J. Smith. In this interdisciplinary lesson, 6th graders complete a math activity converting fractions into decimals and percentages and a geography...
Curated OER
Government Goods and Services
Fifth graders investigate the connection between taxes and government services. In this economics lesson, 5th graders discuss the process and benefits of paying sales and income taxes. Using calculators, students compute the...
Curated OER
"Water is Life" Global Water Awareness
Young scholars examine and calculate the percentage of potable water remaining on the earth. In this ecology and geography lesson, students brainstorm the main factors affecting water distribution. Young scholars use mathematical problem...
Curated OER
Determining the Existence of Gender Bias in Daily Tasks
Help your kids explore gender bias. Learners design and conduct a survey examining role responsibilities within families. They determine the percentage of responsibilities for males vs. females and graph the results. Then they analyze...
Curated OER
Who Represents You?
Students investigate Congress and how individuals are represented in this Country. In this government lesson, students complete worksheets research government web sites to determine which senators and congressmen represent them....
Federal Reserve Bank
So How Much Are You Really Paying for that Loan?
Loans are rarely provided without a cost. Pupils evaluate the high cost of using a payday loan or payday advance through discussion and worksheets, and finally work in groups to develop short public service announcements...
Curated OER
Closing the Salary Gap
Students explore careers in their community and compare the average salaries for men and women working in those careers. They explore a variety of careers available in their community through participating in this lesson.
Curated OER
Book: Latinos Today: Facts and Figures
Students, after reading Chapter 1 in the book, "Latinos Today: Facts and Figures," identify and characterize the four main ethnic/racial groups in America. They calculate and design a bar graph showing their populations by their...
Curated OER
Credit: Taking an Interest in Credit
Students examine how credit works but looking at how credit cards and interest rates work. They use percentages to solve problems using credit card interest rates while completing a worksheets.
Curated OER
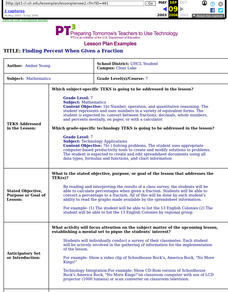
Finding Percent When Given A Fraction
Seventh graders calculate percentages when given a fraction. They convert a percentage to a fraction. All of this be done by each student's ability to read the graphs made available by the spreadsheet information.
Other popular searches
- Math Percentages
- Math Lessons on Percentages
- Calculator Math Percentages
- Learning Math Percentages
- Math Percentages Diagram
- Teaching Percentages in Math
- Math Percentages Ecology
- Math Percentages Decimals
- Teaching Math Percentages
- Football Math Percentages
- Everyday Math Percentages
- Converting Math Percentages


