Texas Instruments
Texas Instruments: The Stock Market Project
Students pick a stock that they would like to follow for a period of 2 weeks. Each day they look up the stock and chart its price. At the end of the two week period they graph their data using the graphing calculator. They compare their...
Texas Instruments
Texas Instruments: From Tables to Graphs
Students learn how to generate a table of values showing the accumulated amounts of a sum of money compounded over n periods. They graph these values and learn how to determine the accumulated amount corresponding to any given period.
Texas Instruments
Texas Instruments: Stay Tuned: Sound Waveform Models
In this activity, students' will record the sound waveform of a tuning fork and analyze the waveform to determine frequency, period and amplitude information. They will model the waveform using trigonometric functions.
Texas Instruments
Texas Instruments: Swinging Along
Students model the data from the motion of a pendulum by a periodic function. They relate its parameters to the time for one period, the distance it is pulled back, and its distance from the motion detector.
Texas Instruments
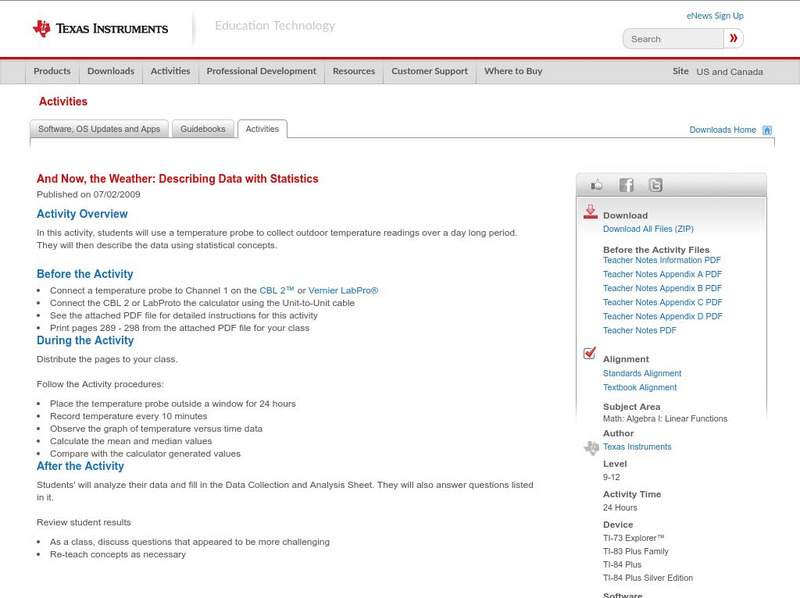
Texas Instruments: And Now, the Weather: Describing Data With Statistics
In this activity, students can use a temperature probe to collect outdoor temperature readings over a day long period. They will then describe the data Using statistical concepts.
Texas Instruments
Texas Instruments: Geologic Time Line
A time line of Earth's geologic periods from 600 million years ago.
Texas Instruments
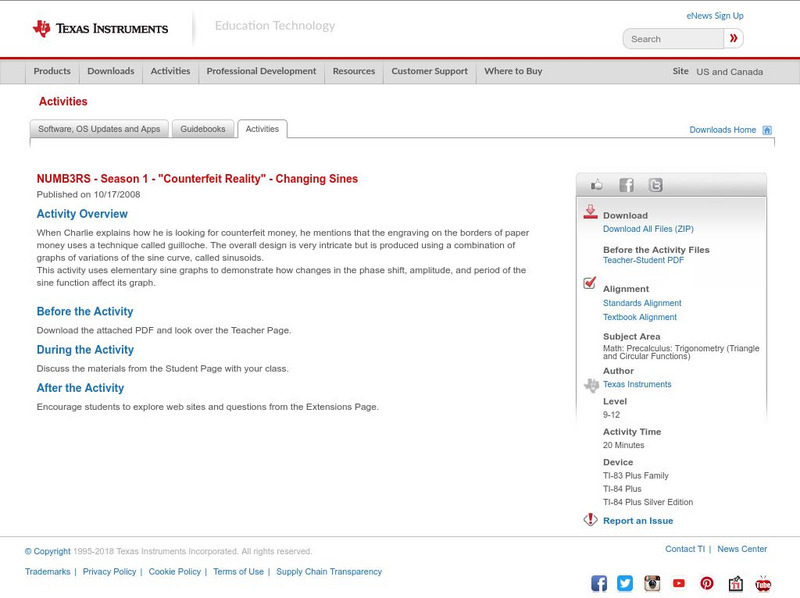
Texas Instruments: Numb3 Rs: Changing Sines
Based off of the hit television show NUMB3RS, this lesson introduced students to the various parameters used in graphing the elementary sine function. Technology use is very heavy, as students are encouraged to graph different sinusoidal...
Texas Instruments
Texas Instruments: Math Today: Red Meat Consumption Continues to Drop
The USA TODAY Snapshot, "Red meat consumption continues to drop," will allow students to work with two sets of data over the same time period. This activity will show how a system of equations can be used to answer questions about the...
Texas Instruments
Texas Instruments: Compound Interest
In this activity, students use the TI graphing calculator to calculate compound interest. They understand that in compound interest computations, the interest from the previous period is added to the current principal and the new total...
Texas Instruments
Texas Instruments: Using Trnsfrm App
This activity introduces the use of TRNSFRM APP and the effect of A and B in AX + B as well as discovering Amplitude, Period and Vertical shift of sinusoids with the aid of a slinky!
Texas Instruments
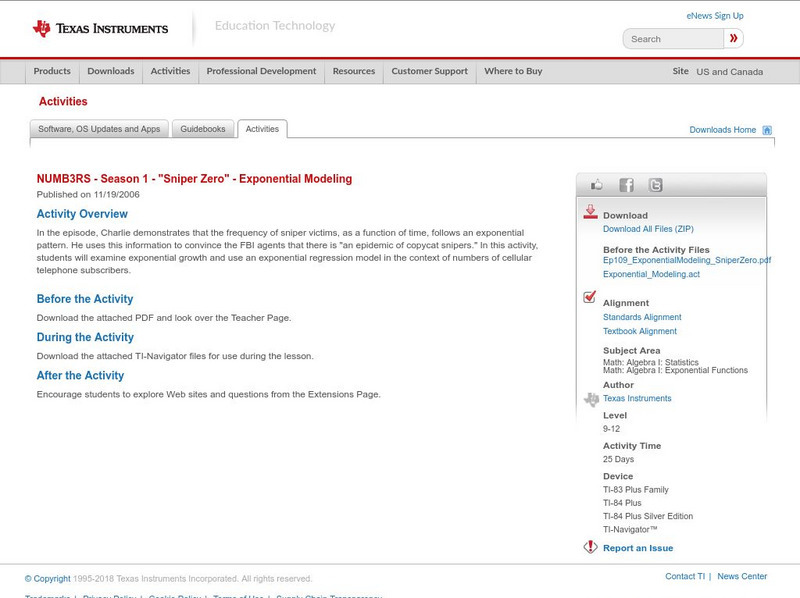
Texas Instruments: Numb3 Rs: Exponential Modeling
Based off of the hit television show NUMB3RS, this lesson introduces students to exponential equations, their graphs, and their application in the real world. The lesson is framed in the context of the number of cell phone users for a...
Texas Instruments
Texas Instruments: Light and Day
In this activity, students will collect temperature and light readings over a 25 hour time period and explore relationships between and within the data. They will discover the relationships of temperature with sunrise and sunset and look...
Texas Instruments
Texas Instruments: Saving for Graduation
In this activity, students use the CellSheet Application to calculate accrued interest on a principal. During the activity students solve a problem to calculate the interest on a principal, for a specified period.
Texas Instruments
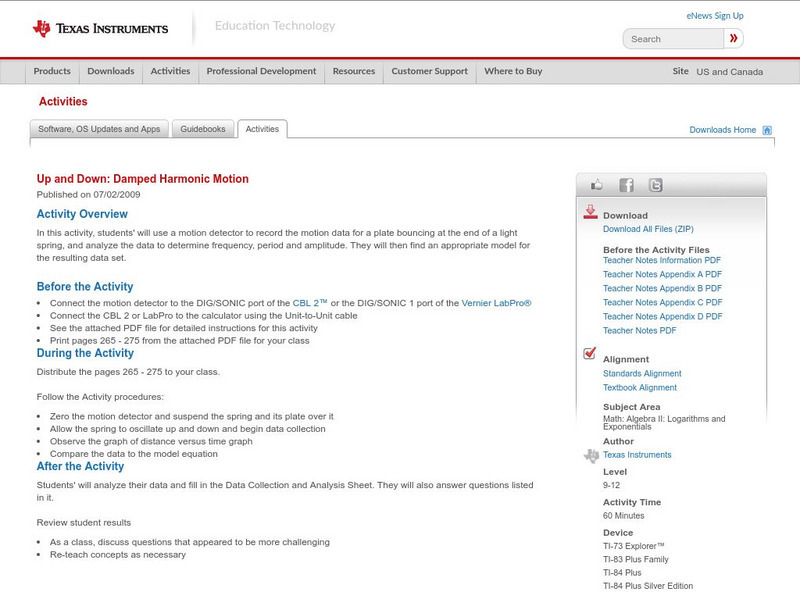
Texas Instruments: Up and Down: Damped Harmonic Motion
In this activity, students' will use a motion detector to record the motion data for a plate bouncing at the end of a light spring, and analyze the data to determine frequency, period and amplitude. They will then find an appropriate...
Texas Instruments
Texas Instruments: Jason: Land Erosion Running Off With Soil
Rainforests at the Crossroads: Examine the relationship between rainfall and runoff on Barro Colorado Island (BCI) over a period of one year. Then examine the data and use the TI-73 Explorer to graph and analyze the values.
Texas Instruments
Texas Instruments: Nevada's Population
In this activity, students examine patterns and use these patterns to try to predict different aspects of an event. They study the statistical patterns for the population of the state of Nevada over a period of hundred years, and predict...
Texas Instruments
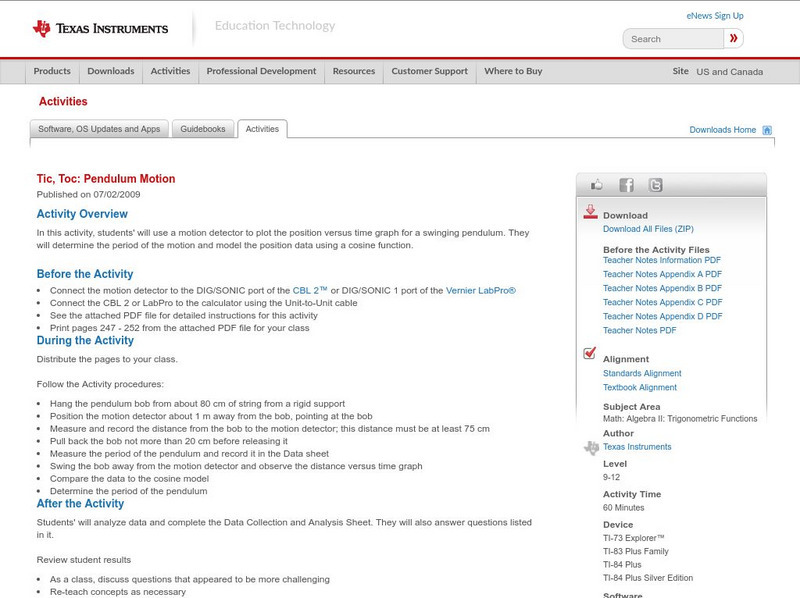
Texas Instruments: Tic, Toc: Pendulum Motion
In this activity, students' will use a motion detector to plot the position versus time graph for a swinging pendulum. They will determine the period of the motion and model the position data using a cosine function.
Texas Instruments
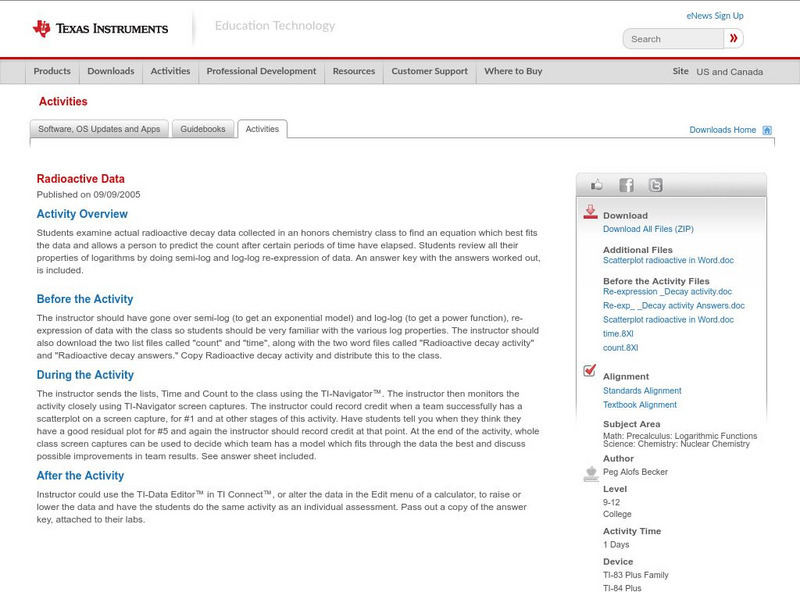
Texas Instruments: Radioactive Data
Students examine actual radioactive decay data collected in an honors chemistry class to find an equation which best fits the data and allows a person to predict the count after certain periods of time have elapsed. Students review all...
Texas Instruments
Texas Instruments: Elements
This StudyCards stack enables students to review elements present in the modern periodic table. Given the atomic number, element name, and the electronic configuration, students find the position (period and column) of the element in the...
Texas Instruments
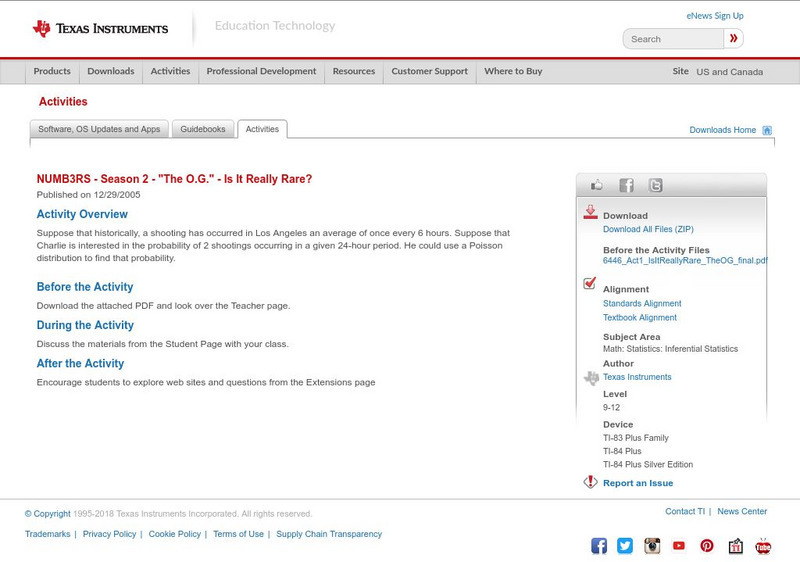
Texas Instruments: Numb3 Rs: Is It Really Rare?
Based off of the hit television show NUMB3RS, this lesson introduces students to the Poisson Distribution to determine the probability of events happening a certain number of times in a given time period. The lesson is framed in the...
Texas Instruments
Texas Instruments: The Area of the Trapeziod
This activity is a based on an activity I saw in Exploring Geometry with the Geometer's Sketchpad. Student will construct a trapeziod and then use rotation to create a parallelogram from the trapeziod. The follow up questions lead the...
Texas Instruments
Texas Instruments: Holt Physics Chapter 11: Vibrations and Waves Pendulum Lesson
This activity Pendulum from Holt Physics Chapter 11 Vibrations and Waves uses the calculator and the VIB program calculate the period of a pendulum on different planets.
Texas Instruments
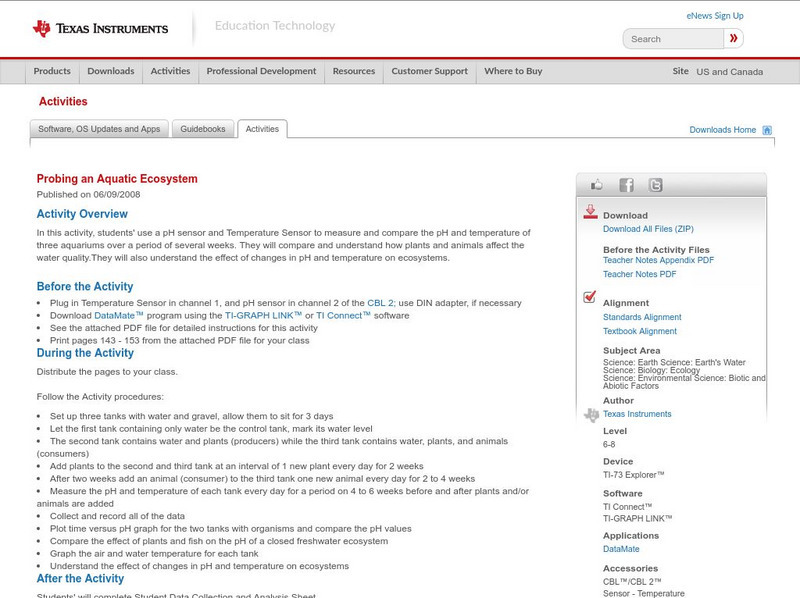
Texas Instruments: Probing an Aquatic Ecosystem
In this activity, students' use a pH sensor and Temperature Sensor to measure and compare the pH and temperature of three aquariums over a period of several weeks. They will compare and understand how plants and animals affect the water...
Texas Instruments
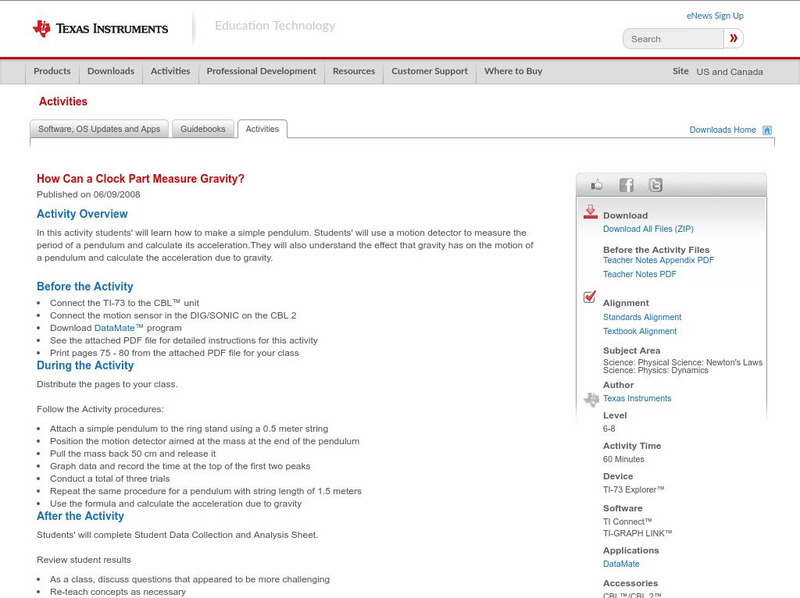
Texas Instruments: How Can a Clock Part Measure Gravity?
In this activity students will learn how to make a simple pendulum. Students' will use a motion detector to measure the period of a pendulum and calculate its acceleration.They will also understand the effect that gravity has on the...
Other popular searches
- Enlightenment Period
- The Enlightenment Period
- Enlightenment Period Unit
- Enlightenment Period English
- Period at End of Sentence
- Medieval Period in England
- English Tudor Period
- English Colonial Period
- Enlightment Period


