Curated OER
Choosing the Best Graph
In this mathematics worksheet, 6th graders use a line graph to illustrate how a measure of data changes and explain their reasoning. Then they use a bar graph to compare pieces of data and a pictograph to compare data.
Curated OER
School Fair
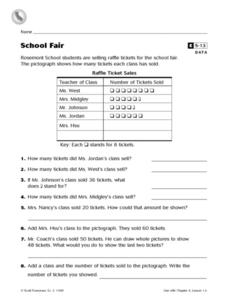
In this data worksheet, learners look over a table containing data collected from selling raffle tickets and then answer 8 short answer questions relating to the table.
Curated OER
Collecting Data
For this data collection worksheet, students read about how data is collected and organized. They also learn about a hypothesis. Students read through examples of different charts and then answer 23 questions pertaining to data...
Curated OER
Math--Pictures and Bars--Learning About Graphs
What is a graph? What does it tell us? How do you make one? These are all questions that are answered in the included packet. It's a great introduction to graphing for young learners!
Curated OER
Pictogram 4: Traveling to the Supermarket
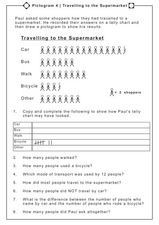
In this creating and comprehending a tally chart worksheet, students use a pictograph to tally the number of ways people traveled to the supermarket, tally the results, and answer comprehensive questions. Students answer 8 questions.
Curated OER
Hats for Sale
What type of hat do you think sells the best? Elementary learners will use the picture graph provided to answer the comprehension questions. A chart accompanies the picture graph, so youngsters can see the data multiple ways.
Curated OER
Bird Pictogram Page 2
In this math worksheet, students examine a pictogram which shows the 4 most common foods of wild birds. Students analyze the pictogram and answer 8 questions about the data displayed.
Curated OER
Picturing Hats
In this pictographs worksheet, students examine a pictograph then solve 11 problems related to the data in the pictograph. Students cross out problems that do not relate to the pictograph.
Curated OER
Going Bananas: Addition and Graphing
In this addition worksheet, 1st graders will look at a picture to add the total number of bananas a monkey eats per day for five daily sums. Then students will answer four short word problems which require students to view the data as a...
Curated OER
Let's Graph It
In this let's graph it worksheet, student interactively answer 10 multiple choice questions about graphing data and types of graphs, then click to check their answers.
Fuel the Brain
Egg Hunt Pictograph
If you did a hypothetical egg hunt in class, wouldn't it be great to see how many eggs were collected? Your youngsters will receive a list of "collected data" and create a pictograph.
Curated OER
Unit 20 Questionnaires and Analysis Extra Exercises 20.1
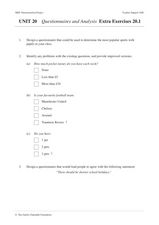
In this statistics worksheet, students design a biased questionnaire. They create data displays based on given statistics. There are a total of 9 problems.
Curated OER
Nine Examples for Tables, Pictographs, Mean. Median, and Mode
For this graphical representation of data and measures of central tendency worksheet, students calculate mean, median, and mode and answer questions related to graphs, tables, and pictographs.
Curated OER
Understanding Statistics
In this statistics worksheet, students examine and interpret pictographs and line graphs. Students analyze the provided data in order to create bar graphs, circle graphs, and box and whisker plots. The nine page worksheet accompanies a...
Curated OER
Pictograms: Animals in the Zoo
For this math worksheet, students examine a pictogram which shows data about how many of 5 species of animals live in the zoo. Students answer 7 word problems about the pictogram.
Curated OER
Word Search Y3 Data
In this word search worksheet, learners find the words in the word search and then circle them. There are 16 words in the word bank for students to locate. They then try to find any other words that they can. The answers are on the...
Curated OER
Pictograph Activity
In this pictograph worksheet, students learn to read a pictograph and answer questions based on the data. Students then draw two of their own pictographs using the given information and answer questions based on graphs.
Curated OER
BBC Bird Pictogram- Math Worksheet
In this British math worksheet, students develop a pictogram based on the information that is given about what certain types of birds like to eat. They see pictures of the birds and their food preferences before completing the data in...
Curated OER
Favorite Season
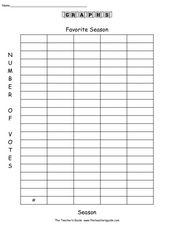
In this graphing worksheet, students conduct a survey of people's favorite survey. They then complete 8 questions about the data gathered before creating a bar graph and pictograph on templates.
Curated OER
Picture Graphs
Are your youngsters learning how to read picture graphs? Use these five examples to asess your learners' comprehension. Consider rearranging them differently; the presentation is slightly congested.
Curated OER
Favorite Animals
In this graphing learning exercise, learners read and answer questions about a picture graph showing the favorite animals of a group of children
Curated OER
Graphing Words Word Search
In this data vocabulary activity, students search for 16 graph-related words in a word search grid. Each word relates to graphing and collecting data.
Curated OER
Numeracy Practice Math Sports
In this math worksheet, students match the pictographs to find the quantities and write each number sentence. They use the operation of addition.
Curated OER
Frequency, Histograms, Bar Graphs
In this statistics worksheet, learners plot and graph their data, then interpret the data using the correct form of graphs. There are 3 detailed questions with an answer key.


