BBC
Bbc: Representing Data
This BBC Math Bite tutorial for line graphs, pictograms, and frequency polygons features an exam in which students draw and interpret statistical diagrams.
Beacon Learning Center
Beacon Learning Center: Play Ball
An interactive web lesson shows examples of pictographs and challenges students to answer questions about the graphs.
Beacon Learning Center
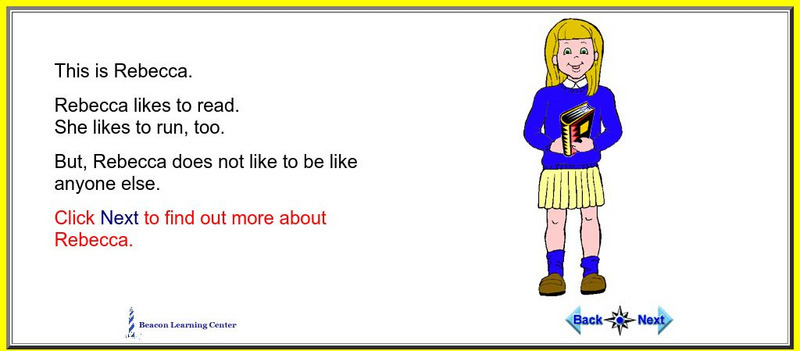
Beacon Learning Center: I Am Special
The activity investigates picture graphs. Learn about Rebecca through picture graphs.
Beacon Learning Center
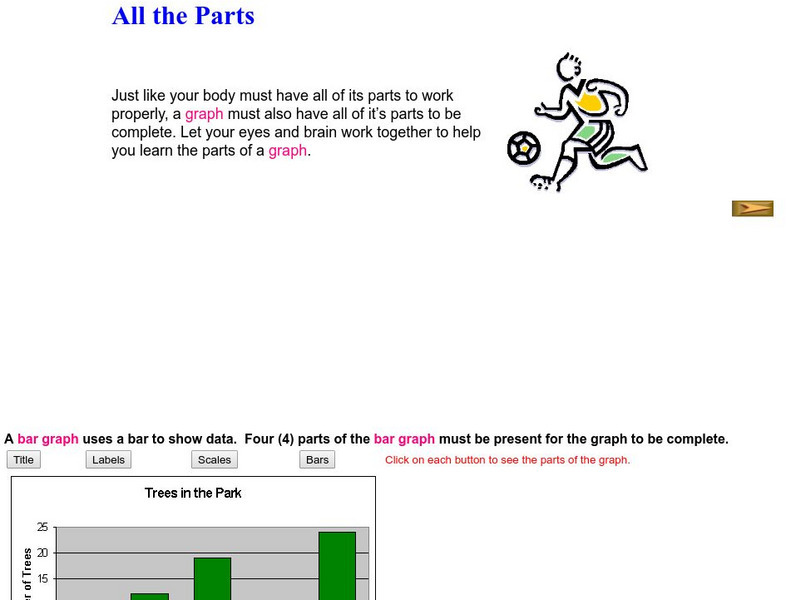
Beacon Learning Center: All the Parts
The activity investigates bar graphs. Students learn about all the parts of a graph.
Beacon Learning Center
Beacon Learning Center: Kinds of Graphs
An interactive web lesson introduces five types of graphs to students and allows them to practice matching the names to examples.
Texas Instruments
Texas Instruments: Taste Test
Students collect sample data and use the calculator to create pictographs, bar graphs, and pie graphs to demonstrate the favorite brand in the sample data.


