Hi, what do you want to do?
Curated OER
Flush It! Throw It! Out of Sight, Out of Mind!
Students describe disposal procedures by reviewing water and solid waste disposal cycles and what happens when one step is omitted. They examine the connection between industry and human health.
Curated OER
Guess Your Best
Students discuss situations when it is useful to know exact weight of object as opposed to estimated weight, estimate weight of various items, weigh them on scale using ounces and pounds, and compare their weights on Guess Your Best...
Curated OER
West Virginia State Museum Lesson Plan: West Virginia Music
Students compare and contrast music about West Virginia. In this West Virginia history instructional activity, students analyze popular music so that they may gain an understanding of the relationships between songs and history. Students...
Curated OER
Calories
Students explore calories. In this instructional activity about calories, students practice counting and recording calories. Students use a sample Calorie Calculation Chart to record how many calories consumed in one day. Students do an...
Curated OER
Closer To the Ground Lesson 2: Providing a Helping Hand
Students examine how businesses and corporations contribute or sponsor activities for the common good. They read annual reports of major corporations to determine how they contribute to focused activities for the common good.
Curated OER
Chessboard Challenge
Second graders read "The King's Chessboard" by David Birch. The teacher reads the story aloud and pauses at several points for students to calculate the next number in a pattern of doubling.
Cuemath
Cuemath: Pie Charts
A comprehensive guide for learning all about pie charts with definitions, solved examples, and practice questions.
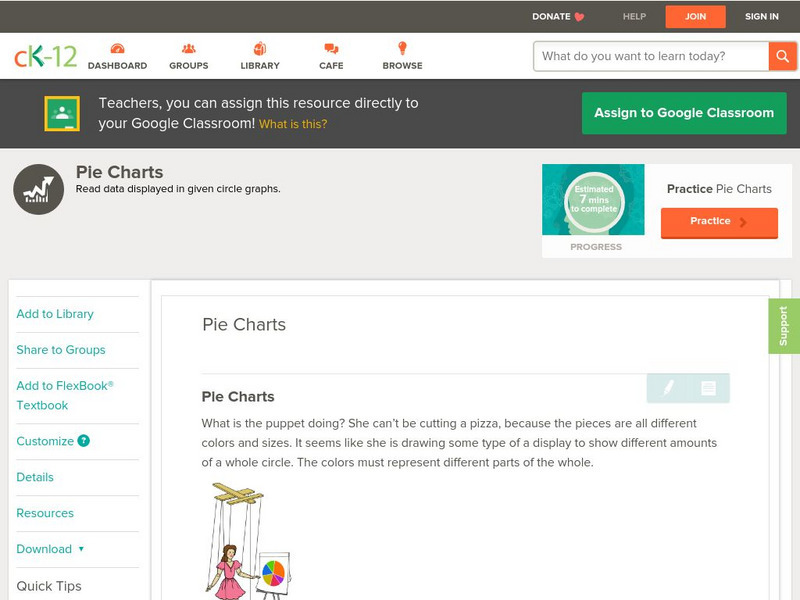
CK-12 Foundation
Ck 12: Statistics: Pie Charts Grades 9 10
[Free Registration/Login may be required to access all resource tools.] Covers representing data in a pie chart.
National Center for Ecological Analysis and Synthesis, University of California Santa Barbara
Ucsb / Pie Graphs (Piece of Cake)
This page gives an example and easy-to-understand description of a pie graph (circle graph.) Also provides an opportunity for students to test their abilities to read a pie graph.
Scholastic
Scholastic: Bars, Lines, and Pies
Students will learn and reinforce skills for creating, applying and analyzing pie charts, bar graphs and line graphs.
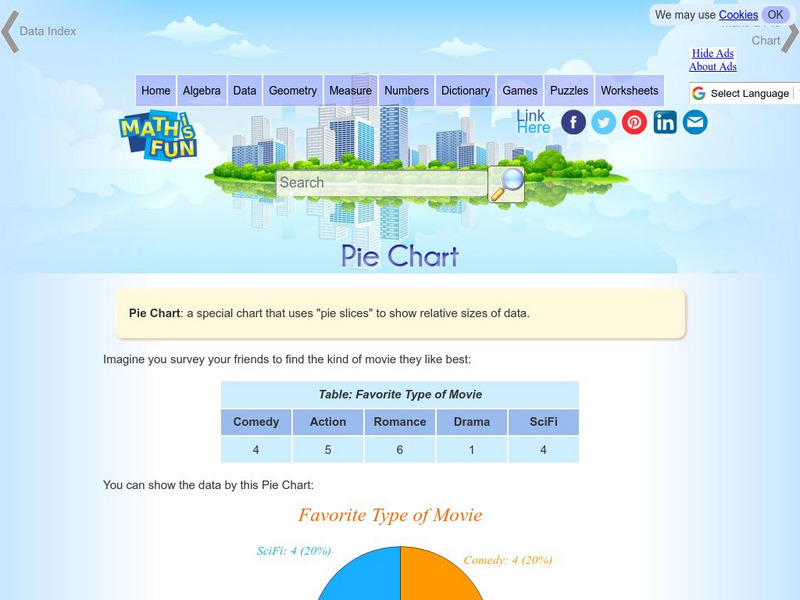
Math Is Fun
Math Is Fun: Pie Chart
Explains, with examples, what a pie chart is and how to make one. Includes a set of practice questions.
Other
Delta State University: Lesson Plan 3: Pie Graphs
The learners will gather, organize, and display data in an appropriate pie (circle) graph using M&M's! [PDF]
Primary Resources
Primary Resources: Line Graphs and Pie Charts
Here are a few resources to use with your students when teaching about line graphs or pie charts.
CK-12 Foundation
Ck 12: Statistics: Pie Charts Grade 6
[Free Registration/Login may be required to access all resource tools.] Interpret circle graphs and make predictions based on the displayed data.
Shodor Education Foundation
Shodor Interactivate: Pie Chart
Students investigate how a pie chart can be used to display data graphically. The resource includes the activity and instructor resources.
Beacon Learning Center
Beacon Learning Center: Piece of Pie
This is a tutorial for creating and practice interpreting pie charts. They use the example of number of people in each of 24 families to demonstrate how the pieces of pie are created. Then questions were asked and students input the...
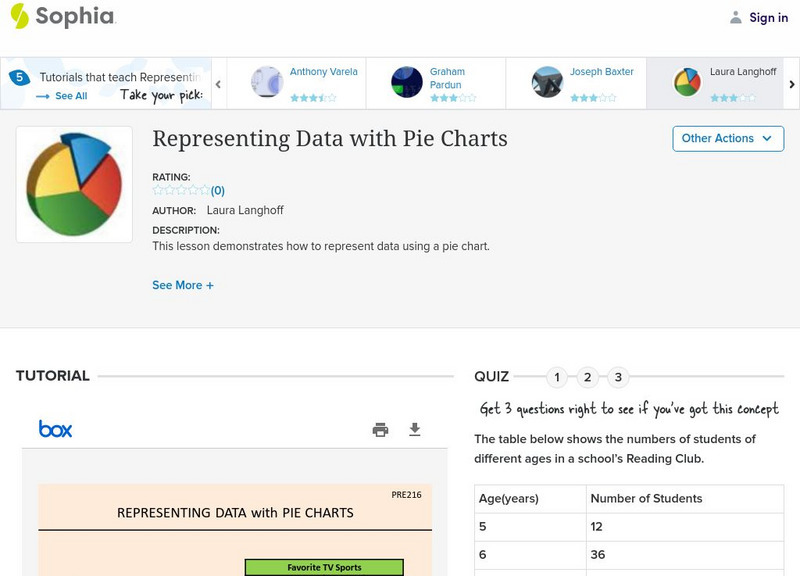
Sophia Learning
Sophia: Representing Data With Pie Charts: Lesson 2
This lesson demonstrates how to represent data using a pie chart. It is 2 of 5 in the series titled "Representing Data with Pie Charts."
Sophia Learning
Sophia: Representing Data With Pie Charts: Lesson 4
This lesson demonstrates how to represent data using a pie chart. It is 4 of 5 in the series titled "Representing Data with Pie Charts."
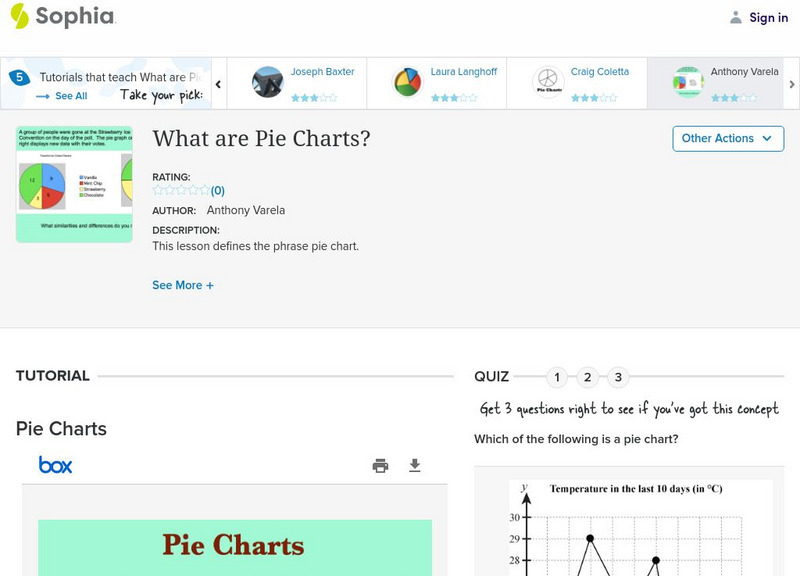
Sophia Learning
Sophia: What Are Pie Charts?
This lesson defines the phrase pie chart. Students can look at a presentation and then take an online quiz.
Other
Abp: P Ie Charts
This site from Accelerators and Beam Physics Group produces pertinent information regarding pie charts. Shows an example of a pie chart and breaks it up for easy learning.
US Department of Education
Nces: How to Create a Pie Chart
Resource from the National Center for Education Statistics provides tools and steps for creating printable pie charts online. Fill in the information, click the necessary buttons, and you have created a pie chart!
Wolfram Research
Wolfram Math World: Pie Chart
This page briefly discusses the use of pie charts (or circle graphs) in representing data. Provides detailed information for understanding.
Other popular searches
- Pie Charts and Graphs
- Interpreting Pie Charts
- Fraction Circles Pie Chart
- Circle Graphs Pie Charts
- Energy Pie Chart
- Reading a Pie Graph
- Creating a Pie Chart
- Bar Graphs, Pie Charts
- Pizza Pie Graph
- Nutrition Facts Pie Graph
- Pie Chart Activity
- M&m Pie Chart


