Curated OER
Weather
Learners create a spreadsheet and chart using data collected. In this weather lesson, students select five cities from their state, including the city they live in. Learners take daily temperature readings from all five...
Curated OER
Surveying the Land
Students explore the different kinds of maps and the purpose of each. For this Geography lesson, students work in small groups to create a map which includes the use of a map key.
Curated OER
Coin Probability
Fourth graders, in pairs, receive three different types of coin bags. They pick coins out of the bag and tally what was picked fifteen times. They do it with all three bags for three separate tallies.
Curated OER
Picture a Nation
Students research immigration data from a specific time period. They create a graphic organizer that depicts the information and share the information with the class.
Curated OER
Looking through the Sands of Time: 80's Decade
Students view the comic "Time sliders" from the Celebrate the Stamp Unit from the 1980's. They discuss what the comic magazine contains. Students listen to a speaker from the post office discuss how stamps are selected. They use...
Curated OER
Thank You... Thomas Edison!
Students investigate the life of Thomas Edison. They research how he made a difference. They understand that accurate data collection is important for math. They create a chart using spreadsheet data.
Curated OER
Virginia In the World: The Geography of Commerce
Students examine how Virginia connects with the world through export trade. Using a map, they use symbols to depict the value of trade and the direction of the flow of goods. They complete a scavenger hunt using electronic almanacs and...
Curated OER
MFL: Young Drivers
Students examine and discuss images from road safety programs. In groups, they role-play a scenerio in which they are trying to persuade the other to adopt an unsafe driving practice. They write a short article about their experiences to...
Curated OER
Virtual Vacation
Young scholars select a foreign city, research the city using the Internet, and plan an eleven-day vacation to that city. This lesson is ideal for a social studies classroom and includes ideas for using iMovie, Excel, and MS Works or...
Curated OER
Houghton Mifflin Social Studies/Chapter 12, Lesson 1 A Struggle for Rights (pp. 270-274)
Fourth graders examine the time period of the 1960's and 70's to have discussions about three different ethnic groups. They examine the issue of discrimination and civil rights. The lesson plan includes a helpful outline with a hyperlink.
Curated OER
Investigating the Food Pyramid
Students examine how the food pyramid is an important nutritional tool. They classify foods and compare the number of servings per group that are necessary for maintaining good health by placing empty food containers in grocery bags.
Curated OER
The ABC's of Industry
Learners define and explore Industry. They access times during the Industrial Revolution in America. Students view how business functions in any economy. They summarize the three sectors of industry by creating and interpreting a web...
Curated OER
Flush It! Throw It! Out of Sight, Out of Mind!
Students describe disposal procedures by reviewing water and solid waste disposal cycles and what happens when one step is omitted. They examine the connection between industry and human health.
Curated OER
Guess Your Best
Students discuss situations when it is useful to know exact weight of object as opposed to estimated weight, estimate weight of various items, weigh them on scale using ounces and pounds, and compare their weights on Guess Your Best...
Curated OER
Closer To the Ground Lesson 2: Providing a Helping Hand
Students examine how businesses and corporations contribute or sponsor activities for the common good. They read annual reports of major corporations to determine how they contribute to focused activities for the common good.
Curated OER
Chessboard Challenge
Second graders read "The King's Chessboard" by David Birch. The teacher reads the story aloud and pauses at several points for students to calculate the next number in a pattern of doubling.
Other
Delta State University: Lesson Plan 3: Pie Graphs
The students will gather, organize, and display data in an appropriate pie (circle) graph using M&M's! [PDF]
National Center for Ecological Analysis and Synthesis, University of California Santa Barbara
Ucsb / Pie Graphs (Piece of Cake)
This page gives an example and easy-to-understand description of a pie graph (circle graph.) Also provides an opportunity for students to test their abilities to read a pie graph.
CK-12 Foundation
Ck 12: Statistics: Pie Charts Grade 6
[Free Registration/Login may be required to access all resource tools.] Interpret circle graphs and make predictions based on the displayed data.
Scholastic
Scholastic: Bars, Lines, and Pies
Middle schoolers will learn and reinforce skills for creating, applying and analyzing pie charts, bar graphs and line graphs.
Math Is Fun
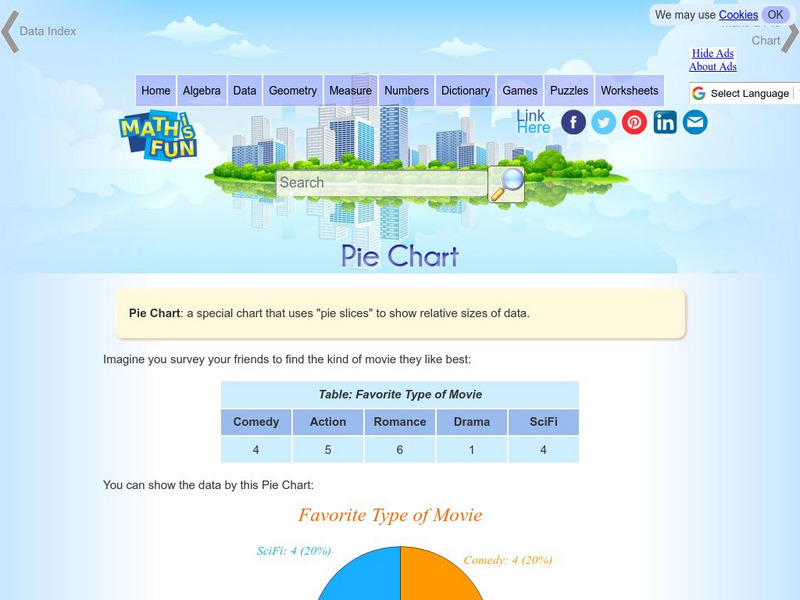
Math Is Fun: Pie Chart
Explains, with examples, what a pie chart is and how to make one. Includes a set of practice questions.
Better Lesson
Better Lesson: Circle Graph Activity
This lesson will allow the student to work through three stations. The stations will focus on creating and analyzing circle graphs. The students will be using technology to create their graphs along with a hands-on activity using M&M's.
McGraw Hill
Glencoe: Self Check Quizzes 2 Circle Graphs
Use Glencoe's Math Course 2 randomly generated self-checking quiz to test your knowledge of circle graphs. Each question has a "Hint" link to help. Choose the correct answer for each problem. At the bottom of the page click the "Check...
Primary Resources
Primary Resources: Line Graphs and Pie Charts
Here are a few resources to use with your students when teaching about line graphs or pie charts.


