Curated OER
Pies and Percentages--Learning About Pie Graphs
In this pie graph activity, students draw a pie graph for the zookeeper with the data he collected, choose a different color for each animal species and make a key to the graph.
Curated OER
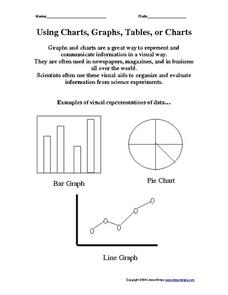
Using Charts, Graphs, Tables, or Charts
In this charts, graphs and tables activity, students view 3 different types of visual representations of data, make a list of 20 items and decide how the items can best be put together in groups to make a graph, chart or table. Students...
Curated OER
Let's Go Shopping
In this fraction and pie chart worksheet, students draw a line from the toys with the prices of 50 cents, 75 cents, and 25 cents to the pie chart that show the part of a dollar the toy costs.
Curated OER
Trash a Pizza!
Students investigate data about America's trash production. In this environmental instructional activity, students use statistics about what we throw away to create an art pie chart project called a "trash pizza."
Curated OER
Instructions for Assembly of 'Opae" ula life-cycle wheel
Students study Opae ula. In this life cycle, art lesson, students color and cut out the printout of the life cycle of the Opae ula (red shrimp of Hawaii). They work independently to create the pie chart representing this life cycle. This...
Curated OER
Math--Fractions and Percentages
In this fractions and percentages instructional activity, learners write down the percentages of a pie chart and change then into fractions. Students change 7 fraction sentences into a percentage sentence.
Curated OER
Equal Parts
In this equal parts worksheet, students, working with a partner, study, formulate and calculate the answers to six word problems or drawings.
Earth Day Network
Conserving Water Through Art!
Having fresh, clean drinking water is a privilege many people take for granted. Help raise awareness about the scarcity of water and the importance of conservation by discussing different ways water is used in everyday life. Brainstorm...
Curated OER
"Graph It"
Young scholars work in teams to conduct short surveys of their classmates. They show their results using at least two different types of graphs.
Students separate into teams and are asked that each team to choose something that they are...
Curated OER
Which Color Will You Pick?
Students create a spreadsheet to chart the different colors found in a package of M&M's or Skittles. They collect data, create appropriate charts, and use percentages to describe quantities.
Curated OER
Color Matters
Young scholars create a spreadsheet to chart favorite colors, then collect data, create appropriate charts, and use percentages to describe quantities.
Curated OER
Clay Ants: Insect Anatomy
Students examine anatomic structures in order to identify insects from other living organisms. They gain a level of comfort from anxiety when observing and handling live and pinned insects. They create clay models of an insect.
Curated OER
Planet Protectors
Students explore ways to protect the earth. In this environmental issues and technology instructional activity, students investigate the water quality in their community and compare their findings to the water quality in other...
Curated OER
Animal Masks
Students design and make animal masks. In this research and application lesson plan, students use a computer to research what a panther eats, select an animal mask they want to make and then use the materials provided to create...
Curated OER
Lifestyles of an Olympic Hopeful
Students compare and contrast their lives with one other teenager in the United States (or another country!) who has aspirations of becoming an Olympic athlete. They address quality of life issues.
Curated OER
Looking through the Sands of Time: 80's Decade
Students view the comic "Time sliders" from the Celebrate the Stamp Unit from the 1980's. They discuss what the comic magazine contains. Students listen to a speaker from the post office discuss how stamps are selected. They use...
Other popular searches
- Pie Charts and Graphs
- Line Pie Bar Graph
- Circle Graphs Pie Charts
- Bar Graphs, Pie Charts
- Paper Pie Chart/graph
- Graphing Pie Charts
- Bar Graphs Pie Charts
- Bar Graphs and Pie Charts
- Pie Charts Graphs
- Pie Chart Circle Graph
- Pie Chart Graphs

