Curated OER
Bar and Histograms (What Would You Use: Part 1)
High schoolers practice creating bar graphs using a given set of data. Using the same data, they create a group frequency chart and histograms. They must decide the best graph for the given set of data. They share their graphs with...
Curated OER
Using Non-Text Features
Second graders examine graphs and charts from their local newspaper. As a class, they discuss what the data means and how it relates to the article. In groups, they are shown two sets of graphs or charts and they practice explaining...
Curated OER
Thanksgiving Menu
In this Thanksgiving instructional activity, students complete a T-Chart of foods from the first Thanksgiving and foods from present day Thanksgiving. Students complete two lists.
Curated OER
The Meaning of Fractions
In this fractions worksheet, learners complete different kinds of fraction problems. Students complete 50 problems total where they solve, shade, and put numbers into a chart.
Curated OER
Collecting Data
In this data collection instructional activity, learners read about how data is collected and organized. They also learn about a hypothesis. Students read through examples of different charts and then answer 23 questions pertaining to...
Curated OER
Understanding Pi.
Students study the relationship between circumference and diameter to come up with Pi. "In this pi lesson, students measure, record and find the ratio "circumference/diameter" and their average which is an approximation of pi.
Curated OER
Graph Both Crusts
Fourth graders calculate the angles and construct a pie graph of the percentages of the elements in the continental and oceanic crusts. Then they analyze the results. They can be assigned the task of researching the percentages.
Curated OER
Nationalism and Immigration
High schoolers use the internet to research how immigration patterns changed after 1880. Using this information, they create a pie chart to organize it effectively and discuss how immigration changed Europe and the United States. They...
Curated OER
Homonym, Homophone, Homograph
In this language arts worksheet, students learn the difference between homophones, homographs, and heteronyms by reading this informative chart. Detailed examples are given for all. There are no questions on the page.
Curated OER
Which Color Will You Pick?
Students create a spreadsheet to chart the different colors found in a package of M&M's or Skittles. They collect data, create appropriate charts, and use percentages to describe quantities.
Curated OER
Magical Moon
Young scholars identify what letter moon begins with and the sound that the letter M makes. They identify various pictures held up by the teacher and if they have the /m/ sound. Finally, students practice writing the letter M on chart...
Curated OER
An Apple A Day
Students create a graph that showcases their pick for favorite kind of apple. Students are given samples of a variety of apples to determine their favorite in a taste test. They a create a tally chart of favorite kinds apples and use a...
Curated OER
Graphing
Fifth graders create graphs based on climate in South Carolina. They read and interpret information in a chart and construct a graphy from the information in the chart. They create a spreadsheet using Excel and publish 2 graphs.
Curated OER
Our Animal Friends
Students use the internet to find information pertaining to the benefits of pets. They list their results on a database. They find and record data on the percent of households that own pets as well as the top six species of pets. Once...
Curated OER
Fractions: Add and Subtract
In this fractions worksheet, students count the spare change they have at home and complete a chart, filling in coin values, number they have and total value for each. Students then represent the make a pie chart to represent fractions...
Curated OER
Color Matters
Students create a spreadsheet to chart favorite colors, then collect data, create appropriate charts, and use percentages to describe quantities.
Curated OER
Thank You... Thomas Edison!
Learners investigate the life of Thomas Edison. They research how he made a difference. They understand that accurate data collection is important for math. They create a chart using spreadsheet data.
Curated OER
Calories
Students explore calories. In this lesson plan about calories, students practice counting and recording calories. Students use a sample Calorie Calculation Chart to record how many calories consumed in one day. Students do an experiment...
Curated OER
Old Mother Twitchett
Students view and discuss the a-rhyme-a-week poster"Old Mother Twitchett." They review the vocabulary from the chart and then focus on the pictures. Each student then chants the rhyme as they are taught the words to the riddle rhyme.
Curated OER
Ruler Race
In this length measurements activity, students play a game with a partner that helps them measure the three lengths on the pie charts. Students spin a pencil or paper clip to find the measurement and use a ruler to draw the length from...
Curated OER
Watershed Works: Unit 2
The second of a three-unit lesson plan, this focuses on how human-made structures affect watersheds. Using watershed models that were built during the first unit, junior geologists now place buildings, dams, or levees into the models and...
Curated OER
Zoom Broom
Learners explore comprehension strategies as they listen to Zoom Broom by Margie Palatini. As the story is read, teacher and pupils will stop occasionally to make text-to-text, text-to-self, or text-to-world connections. They also...
Curated OER
M&Ms Count and Crunch
Students practice skills involving statistics and probability by making predictions on number of each color candy in one pound bag of M&Ms. They record both guesses and actual quantities, calculate percentages, and create bar graphs...
Make Take Teach
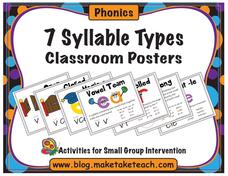
7 Syllable Types - Classroom Posters
Review r-controlled words, open and closed vowels, and dipthongs with a set of classroom posters. Each page features one concept with a colorful illustration, an explanation, and a list of applicable words.


