National Park Service
News Bearly Fit to Print
There are an average of three human fatalities by bears in North America every year, which is low when you compare it to the 26 killed by dogs and the 90 killed by lightning annually. The lesson encourages researching human-bear...
Curated OER
Laurence Yep's, Dragonwings
Learners discuss vocabulary words and compare definitions. They read chapters 6-9 of the novel, Dragonwings, and discuss point of view, and complete a plot diagram. Then they review the four types of conflict and identify the conflicts...
Sri Atmananda Memorial School
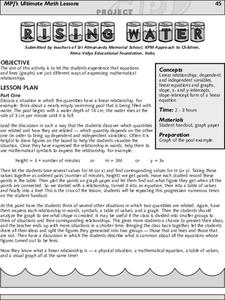
Rising Water
An engaging, and not to mention attractive, lesson plan has prealgebra and beginning algebra scholars examining linear relationships. They consider the rising water level as a swimming pool is being filled. They do so by charting and...
Curated OER
Equilibrium
Twelfth graders and college students alike work on great practical application problems related to supply and demand with this worksheet series. There are five different worksheets containing graphs, charts, and scenario based problems...
Curated OER
Eat Your Veggies
Students investigate displaying data. In this displaying data lesson plan, students use tallies to count data about food preferences. Students use various types of graphs such as bar graphs, picture graphs, box-and-whisker plots, etc...
K20 LEARN
Lord of the Flies Unit, Lesson 2: Leader of the Pack
The second activity in the Lord of the Flies unit asks scholars to consider the characteristics of a good leader. After generating a list of these qualities, they annotate a passage from the novel highlighting the leadership qualities of...
Curated OER
Lively Read of the Tale of Despereaux
Students create a character map of the main characters in The Tale of Despereaux. After reading the text, students create a character chart based on information they gleaned from the story. They use this information to write a letter...
Curated OER
Story Setting - The Art Lesson by Tomi dePaola
Students read the book The Art Lesson by Tomi dePaola and analyze the story. In this setting lesson, students discuss the importance of the setting and how it helps us understand the story. Students answer questions and chart their...
Curated OER
THE GULF STREAM
Students explore how to describe the Gulf Stream, how Benjamin Franklin charted it, and correctly plot it on a map.
Virginia Department of Education
May I Have Fries with That?
Not all pie graphs are about pies. The class conducts a survey on favorite fast food categories in a lesson plan on data representation. Pupils use the results to create a circle graph.
Curated OER
Walk-A-Thon
Students graph linear http://www.lessonplanet.com/review?id=180542equations. In this problem solving lesson, students calculate slope and plot ordered pairs on a coordinate grid. Using a real-life example of a walk-a-thon, students...
Curated OER
Information Problem Solving
Learners locate the specific elements of text and illustrations that communicate setting, characterization, and plot in order to evaluate how the text and illustrations work together to communicate effectively.
Curated OER
What a Character!
Middle schoolers read a novel and discuss character personality. First, they analyze a character in a novel and keep a chart or web of the character's identity, which includes specific examples from the book. They then write a script...
Curated OER
A Tale of Two Quarters
Have your class use the life of a quarter to understand and design plot and flow charts. They read the book, The Go-Around Dollar, think about how their teacher got her quarters that day, then create a flow chart. They have to show how...
Curated OER
National Marine Sanctuaries Shipwrecks
Junior oceanographers access the Channel Islands National Marine Sanctuary Shipwreck Database and plot the locations of several shipwrecks. Shipwrecks are always an enthralling subject and this activity allows your learners to act as...
Charleston School District
Graphing Functions
How do letters and numbers create a picture? Scholars learn to create input/output tables to graph functions. They graph both linear and nonlinear functions by creating tables and plotting points.
Curated OER
I Am An Author
Analyze and interpret a literary work your class has read during the course. After reading a variety of literary works, middle schoolers alter the ending of a selection by creating an alternate ending. They generate five comprehension...
Curated OER
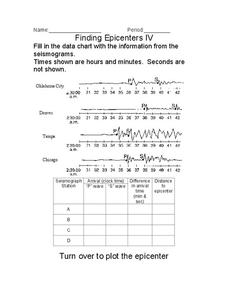
Finding Epicenters
In this earthquake learning exercise, students use the seismographs from different locations to determine the epicenter for the earthquake. Students plot the epicenter on a map. This learning exercise has 1 graphic organizer.
Curated OER
What's in a Graph?
How many yellow Skittles® come in a fun-size package? Use candy color data to construct a bar graph and a pie chart. Pupils analyze bar graphs of real-life data on the Texas and Massachusetts populations. As an assessment at the end of...
Curated OER
Hot and Cold Colors
Students experiment with the color and solar energy absorption. In this color and solar energy absorption lesson, students spend two days discussing and experimenting with the concept of energy absorption. They paint cans with different...
Curated OER
Take a Chance on Probability
Connect ratios, probability, and combination outcomes with a challenging activity idea. It guides your learners through probability of an event as fractions or ratios, on a number line, and with correct vocabulary. The class will be...
Curriculum Corner
7th Grade ELA Common Core Checklists
Track your class's progress on all of the ELA Common Core standards with these handy charts. Along the left side, each seventh grade identifier is listed along with the full text of the standard. As you teach, reteach, assess, and...
It's About Time
Mass Extinction and Fossil Records
The focus of a fossil-based lesson uses graphs and charts that allow young paleontologists to make inferences about events of mass extinction. They must apply their previous knowledge about fossil records in this final lesson of the...
Willow Tree
Circle Graphs
Pie isn't just for eating! Scholars learn to create pie charts and circle graphs to represent data. Given raw data, learners determine the percent of the whole for each category and then figure out the degree of the circle that percent...
Other popular searches
- Literature Plot Charts
- Liter Art Plot Charts
- Plot Charts for Reading
- Plot Charts for Literature
- Literart Plot Charts
- Literary Plot Charts
- Plot Charts Christmas


