Curated OER
Basic Algebra and Computers: Spreadsheets, Charts, and Simple Line Graphs
Students, while in the computer lab, assess how to use Microsoft Excel as a "graphing calculator." They view visual representations of line graphs in a Cartesian plane while incorporating basic skills for using Excel productively.
Curated OER
Excel temperature Graphs
Learners gather data about the weather in Nome, Alaska. In this Nome Temperature lesson, students create an excel graph to explore the weather trends in Nome. Learners will find the average weather and add a trend line to their graph.
Curated OER
One, Two, Three...and They're Off
Students make origami frogs to race. After the race they measure the distance raced, collect the data, enter it into a chart. They then find the mean, median, and mode of the data. Next, students enter this data into Excel at which time...
Curated OER
Integrate Algebra Regents Exam Bimodal Questions Worksheet #1
For this Integrated Algebra worksheet, students solve problems that reflect the topics covered during the course of work. The answer key identifies each question by standard and topic. The twenty-four page worksheet contains two...
Curated OER
Cantilevers
Students perform an experiment to find the linear relationship between the appllied weight and the bend of the cantilever. In this linear relationships lesson, students follow detailed directions to set up an experiment. They add weights...
Curated OER
Calculating Total From Percents
Using this short review of finding a percentage of a number, learners can practice important skills. There are twelve questions on this worksheet.
Alabama Learning Exchange
Scaling Down the Solar System
Learners work collaboratively to gain a better understanding of the vastness of space by scaling down the solar system. They measure by inches, gain an understanding of space, and model the distances of the planets from the sun.
Curated OER
Graphing Points: Pre Test
In this graphing points worksheet, students complete multiple choice questions about axis's on a graph and points on a graph. Students complete 10 questions total.
Curated OER
The Relationship Between Slope and Perpendicular Lines
In this perpendicular lines worksheet, students explore the relationship between perpendicular lines and slope in eight exercises and two worked examples. The solutions are provided.
Curated OER
Childhood Obesity
Students identify a question to generate appropriate data and predict results. They distinguish between a total population and a sample and use a variety of methods to collect and record data. Students create classifications and ranges...
Curated OER
Percentages: Calculating Percent-1
In this percentages worksheet, students calculate percentages in eighteen problem solving percentage equations. Students show each step of their work.
Helping with Math
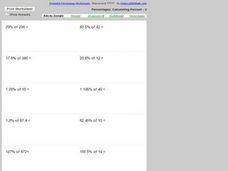
Percentages: Calculating Percent - 2
Here is a worksheet on which math classes practice calculating the percentage of different numbers. Some of the percentages involve decimals, so this would not be an assignment for first-time percent calculators! You can print the...
Helping with Math
Ratio and Proportion: Simplifying Ratios (1 of 2)
Here is a set of 24 pairs of numbers for which kids reduce the ratios to their simplest form. It is a simple and straightforward assignment, meant by the publisher to address CCSS.Math.Content.6.RP.3. Note, however, that it only requires...
Curated OER
What's Your Line?
Fifth graders collect temperature readings over a period of time, enter the information into a spreadsheet and choose the appropriate graph to display the results.
Curated OER
Aruba Cloud Cover Measured by Satellite
Students analyze cloud cover and to compose written conclusions to a given related scenario. They submit a letter of response and a report detailing their calculations and conclusions.
Curated OER
EE*Pro App
Scholars investigate EE*Pro App. In this secondary mathematics lesson plan, let your class explore an all-inclusive App for electrical engineering students. The App is organized into analysis, equations, and references.
Curated OER
Architecture of the Skeleton
Students experiment with skeletons. In this bone health lesson, students analyze, construct, and perform comparative investigations with bones. They make inferences about the structure and function of various bones. This lesson includes...
Curated OER
Mystery Graphs
Students study graphs and learn how to display information into a graph. In this graph lesson plan, students construct a graph of their own sorted data, and pick out things in graphs that are inconsistent.
Curated OER
Hit Me If You Can!
Learners graph linear equations using slopes and intercepts. In this algebra lesson, students identify the slope as being positive,negative or undefined. They differentiate between different quadrants on a coordinate plane.
Curated OER
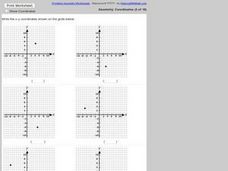
Identifying Points in the Coordinate Plane
In this ordered pairs worksheet, learners identify 6 ordered pairs given a coordinate plane. Students list the ordered pair given the graph.
Curated OER
Math: Solving Area and Perimeter Problems
Students visit www.explorelearning.com/ Website to solve problems in area and perimeter. Next, they locate the vertex of a quadratic equation. In groups, students construct application problems and exchange them with other groups to...
Curated OER
Points in the Complex Plane -- Lab
Students review the lecture portion of this lesson. Individually, they graph various points on a complex plane and identify conjugates based on their location on the graphs. They complete a worksheet and review their answers to end the...
Curated OER
Percentages: Decimals To Percent
In this percentages activity, students write twelve decimals as percentages and twelve percentages as decimals. Students check their answers with the key when they are finished.
Curated OER
Percentages: Fractions To Percent
In this percentages worksheet, students write eighteen fractions as percentages. Students problem solve each fraction as a percentage.
Other popular searches
- Short Story Plot Diagram
- Creation Myth Plot Diagram
- Plot Diagram the Outsiders
- Blank Story Plot Diagram
- Julius Caesar Plot Diagram
- Plot Diagram for Fiction
- Free Story Plot Diagram
- Creating Plot Diagram
- Story Plot Diagram Steps
- Folktale Story Plot Diagram
- Plot Diagram for Stories
- Story Plot Diagram Samples


