Curated OER
Compare and Contrast Essays
One of these things is not like the other. But, so what? Why is it important to examine the similarities and differences between two entities? Here's a presentation that shows viewers how to go beyond a mere listing to create and...
Common Sense Media
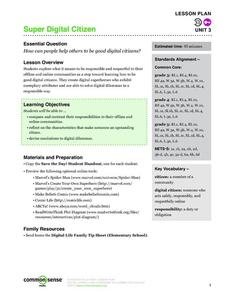
Super Digital Citizen
Teach your charges how to become responsible digital citizens with superheroes! Start out with a brief class discussion about what acting safely, responsibly, and respectfully looks like. Next, have each pupil create their own digital...
Curated OER
Basic Algebra and Computers: Spreadsheets, Charts, and Simple Line Graphs
Students, while in the computer lab, assess how to use Microsoft Excel as a "graphing calculator." They view visual representations of line graphs in a Cartesian plane while incorporating basic skills for using Excel productively.
Curated OER
Excel temperature Graphs
Students gather data about the weather in Nome, Alaska. In this Nome Temperature lesson, students create an excel graph to explore the weather trends in Nome. Students will find the average weather and add a trend line to their graph.
Curated OER
Using Inspiration Software to Explore Characters In Stories
Students identify characters, their qualities, and examples of their qualities and use Inspiration to organize them in a clear and understandable format. After a lecture/demo, students use the program on the next story by themselves.
Other popular searches
- Short Story Plot Diagram
- Creation Myth Plot Diagram
- Plot Diagram the Outsiders
- Blank Story Plot Diagram
- Julius Caesar Plot Diagram
- Plot Diagram for Fiction
- Free Story Plot Diagram
- Creating Plot Diagram
- Story Plot Diagram Steps
- Folktale Story Plot Diagram
- Plot Diagram for Stories
- Story Plot Diagram Samples


