Math Worksheets Land
Halloween Cartesian Art: Bat
Get the class batty over graphing. Young mathematicians plot ordered pairs in all quadrants of a Cartesian plane, and connect the points to create a bat.
Curated OER
da Vinci: Body Proportion Theories
Middle schoolers investigate the validity of da Vinci's proportion theory by recording human measurements on scatter plots. In groups of three, they record each other's height and wingspan to create a Powerpoint presentation, chart, or...
Curated OER
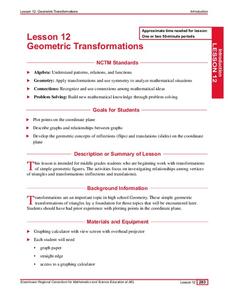
Geometric Transformations
Students solve problems involving transformations of geometric figures. They review graphing points in the coordinate plain, plot points and connect to create a triangle. Then, they reflect triangles over the x and y axis and use...
Curated OER
Plotting Points
Eighth graders practice plotting points on a coordinate plane. As a class, they create and label the parts of a graph. Given ordered pairs, they plot the points, connect them to reveal a particular shape, and find the area of the shape.
Curated OER
Coordinates (4)
In this mathematical coordinates worksheet, students plot the points on a grid with six different sets of coordinates and a ruler to make six separate shapes.
Curated OER
Points as solutions
Ninth graders graph linear functions using coordinate points. For this algebra lesson, 9th graders plot points and graph a line. They use the slope intercept form to graph their equation and evaluate points as solution to the function.
Concord Consortium
Here Comes the Sun
Many phenomena in life are periodic in nature. A task-based lesson asks scholars to explore one of these phenomena. They collect data showing the sunrise time of a specific location over the period of a year. Using the data, they create...
EngageNY
Displaying a Data Distribution
Pupils analyze a display of data and review dot plots to make general observations about the highest, lowest, common, and the center of the data. To finish, learners match dot plots to scenarios.
Curated OER
Scatter Plots
In this Algebra I/Geometry/Algebra II worksheet, students create a scatter plot and analyze the data to determine if the data show any type of correlation. The four page worksheet provides extensive explanation of topic, step-by-step...
Curated OER
Lesson 6-7: Scatter Plots and Equations of Lines
In this scatter plot worksheet, students examine tables and write a linear equation that matches the table. Students graph linear equations. They read scatter plots, determine the trend line, and write a linear equation to match...
Curated OER
Stem-and-Leaf Plots
In this stem-and-leaf plots worksheet, 9th graders solve and complete 9 various types of problems. First, they determine the mean, median, and mode of the stem-and-leaf plot shown. Then, students summarize the similarities and...
Curated OER
Exploring Linear Equations And Scatter Plots - Chapter 5 Review
Students complete rolling stocks experiment, and collect and enter data on the computer. They enter data on graphing calculators, complete scatter plot by hand with line of best fit, and discuss different graphing methods.
Pennsylvania Department of Education
Equal Groups
Students explore statistics by completing a graphing activity. In this data analysis lesson, students define a list of mathematical vocabulary terms before unpacking a box of raisins. Students utilize the raisins to plot data on a line...
Curated OER
Boots
In this graphing practice learning exercise, 5th graders plot squares on a graph with an x and y axis. Once students locate each square they must color a certain design in that box to create a larger picture.
Curated OER
Scatter Plot Basketball
Learners take turns shooting baskets and creating scatterplots based on the data. They create two graphs and look for possible correlation in the data for each graph.
Curated OER
Coordinate Plane Worksheets - Area of Rectangle
In this online math worksheet, high schoolers calculate the area of a variety of rectangles given the measure of their vertices. This excellent resource allows the students to check their answers, and to get "hints" should they run into...
Curated OER
Coordinates on a Shower Curtain: Math
Students use a shower curtain to represent a coordinate plane and then physically demonstrate their understanding or ordered pairs as they move from place to place.
Illustrative Mathematics
Puppy Weights
Nobody can say no to puppies, so lets use them in math! Your learners will take puppy birth weights and organize them into different graphs. They can do a variety of different graphs and detail into the problem based on your classroom...
Curated OER
Grab the Candy
In this ordered pairs learning exercise, learners place candy shaped markers on a grid sheet. They roll the dice to form an ordered pair. They place a marker on that grid square and take the candy piece if there is one located there.
Curated OER
Generating Points and Graphing
Students create a table of values to help them plot. In this algebra instructional activity, students plot their points on a coordinate plane creating a graph. They observe and analyze linear functions.
Curated OER
Graphing and the Coordinate Plane
Students examine the four quadrants of Cartesian coordinate plane. They play maze games and coordinate games to discover how to read and plot points on the plane. Students plot points on the coordinate plane and examine the ratio of...
EngageNY
From Ratio Tables, Equations and Double Number Line Diagrams to Plots on the Coordinate Plane
Represent ratios using a variety of methods. Classmates combine the representations of ratios previously learned with the coordinate plane. Using ratio tables, equations, double number lines, and ordered pairs to represent...
Curated OER
Influence and Outliers
Using the TI-Nspire calculator, statisicians identify outliers and their effect on the least-squares regression line. In finding the line of best fit, they determine what points will affect the least squares regressions and what points...
Curated OER
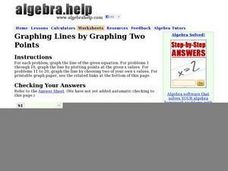
Graphing Lines by Graphing Two Points
Use a graphing lines worksheet to have your mathematicians graph the line of a given equation and plot specified points. The first 10 problems have a given equation, and two values. The next 10 problems have a given equation, but your...


