Curated OER
New York State Testing Program Grade 8 Mathematics Test
In this eighth grade mathematics worksheet, 8th graders are presented with questions indicative of those on the eighth grade mathematics examination. The twelve page worksheet contains six free response questions that cover a variety of...
Curated OER
Algebra/Geometry Institute Summer 2007: Graphing Activity
Seventh graders practice identifying coordinates by examining a city map. In this graphing lesson, 7th graders create coordinate directions on an index card and practice locating these locations on a grid. Students read and discover...
Curated OER
Using Linear Models
For this Algebra II worksheet, 11th graders examine models whose behavior can be described by a linear function. The four page worksheet contains explanation of topic, three guided problems, and eight practice problems. Answers are not...
Curated OER
The Box Problem
Young scholars create graphic, algebraic and verbal ideas of functions. In this algebra lesson, students graph functions and identify the zeros of the functions. They find the domain and range and classify functions as relation or not.
Curated OER
Slip Slide'n Away
Students analyze the sliding of boxes along a warehouse floor. In this algebra instructional activity, students connect math and physics by calculating the friction created by the sliding of each box. They develop faster method to move...
Curated OER
Arc Length - Horse
High schoolers define an arc and calculate its length. In this geometry lesson, students find examples of arc in the real world. They show their understanding of arcs through problem solving.
Curated OER
Skateboard Flex
Students examine statistics by completing a skateboard measuring activity. In this flex lesson plan, students define what skateboard "flex" refers to and identify the proper method of measuring flex by conducting an experiment with...
Curated OER
Typhoon Project
Students graph and outline the path of a typhoon. In this algebra lesson, students measure the path of the typhoon and create a graph with their data. They analyze the data and make predictions.
Curated OER
Playing With Probability
Learners rotate through work stations where they compute problems of theoretical and experimental probability. In this probability lesson plan, students use simulations of a lottery system.
Curated OER
Fitting a Line to Data
Students work together in groups to collect data in relationship to how much water marbles can displace. After the experiment, they use the data to identify the linear equation to determine the best-fit line. They use the equation to...
Curated OER
Graphs and Ellipses
Students explore linear graphs, the parabola and the rectangular hyperbola.
Curated OER
What Percentage of your Class is Right or Lef Handed?
Students using their right hands, put the first letter of their last name in each square on a piece of square grid paper. Then after the 20 seconds is up, they do the same thing using their left hands.
Curated OER
Negative & Positive Numbers
Students recognize positive and negative numbers and perform mathematical functions.
Curated OER
Graphing Integers On a Coordinate Plane
Seventh graders explore the concept of graphing integers on a coordinate plane. In this graphing integers on a coordinate plane lesson, 7th graders discuss scenarios where coordinate systems are used in real life. Students represent...
Curated OER
Walking the Plank
Eighth graders experiment with a bathroom scale, books and a plank to determine how weight readings change as distance is applied. They graph and interpret the results.
Curated OER
Cinderbank
Fourth graders identify major components of a "Cinderella" story in order to create a database.
Curated OER
2 x 2
Students work together to grid a 2 x 2 meter unit using the formula for the Pythagorean Theorem. After creating the grid, they identify the location of artifacts and create a map of their location. They develop a graph and table of their...
Curated OER
Area of Parallelograms
Seventh graders review the process of finding the area of a rectangle and complete a couple of examples as a class. They discuss what a parallelogram is and what the formula would be for finding its area. They listen to an explanation...
Curated OER
How Wealthy Are Europeans?
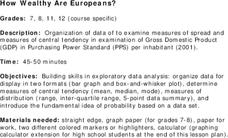
Students investigate measures of central tendency. They examine compiled data and conduct critical analysis. The graph is focusing on the gross domestic product data. The lesson also reviews the concept of putting values in order of...
Curated OER
Polar and Cartesian Coordinates
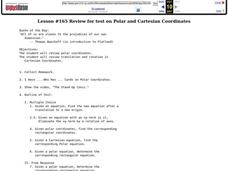
Students review polar coordinates, as well as translations and rotations in Cartesian Coordinates. They also watch a video on conics and write a summary of the video for a quiz grade. Students then find an equation after a...
Curated OER
Properties of Logarithms
Eleventh graders investigate logarithms. In this Algebra II lesson, 11th graders explore the properties of logarithms that are used to simplify expression and solve equations. Students confirm their conjectures regarding the properties...


