The Franklin Institute
Frankin Institute Online: Group Graphing
This site from The Franklin Institute explores how to make a simple graph using a spreadsheet to portray survey data. It also gives a set of interesting sports-related web sites so that students can get statistical inforamtion.
Washington State University
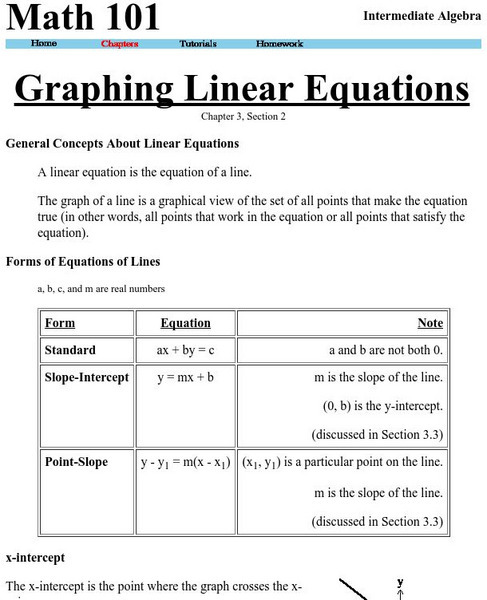
Washington State University: Graphing Linear Equations
This site explains what a linear equation is, general forms of linear equations, how to graph a line using the method of plotting points. The site also details how to find points on the line given the equation, information about the...
University of Regina (Canada)
University of Regina: Math Central: Basics of Graphing
Students learn the basics of graphing including terminology, plotting, and reading points. The lesson has an overview, materials, procedures, and evaluation techniques.
University of Regina (Canada)
University of Regina: Math Central: Basics of Graphing
Students learn the basics of graphing including terminology, plotting, and reading points. The lesson plan has an overview, materials, procedures, and evaluation techniques.
Purple Math
Purplemath: Graphing Rational Functions: Introduction
To graph a rational function, you find the asymptotes and the intercepts, plot a few points, and then sketch in the graph. Once you get the swing of things, rational functions are actually fairly simple to graph. This resources provides...
PBS
Pbs Learning Media: Locating Points on the Cartesian Graph
In this interactive, students use clues and logic to plot the location of aquatic animals on a Cartesian graph that represents the four cardinal directions. The three riddles in the interactive, including one that requires students to...
Khan Academy
Khan Academy: Plot Numbers on the Complex Plane
Given a complex number, plot its corresponding point on the complex plane. Students receive immediate feedback and have the opportunity to try questions repeatedly, watch a video or receive hints.
Texas Instruments
Texas Instruments: Defining the Parabola
The teacher will graph a horizontal line and plot a point using TI-Navigator, and the class will provide the points that create a parabola.
PBS
Pbs Learning Media: Everyday Algebra Plus: Targeted Math Instruction
Algebra lesson focuses on using patterns and relationships to write equations with two variables to represent relationships and patterns in real-world problems, plotting ordered pairs on a coordinate grid, and interpreting the meaning of...


