Hi, what do you want to do?
PBS
Pbs Learning Media: The Coordinate Grid: Targeted Math Instruction
At the end of this lesson about the coordinate grid, students will be able to identify x- and y-axes, point of origin, quadrants, coordinates, and ordered pairs, and read, interpret, and plot points in any of the quadrants.
University of Regina (Canada)
University of Regina: Math Central: Basics of Graphing
Students learn the basics of graphing including terminology, plotting, and reading points. The instructional activity has an overview, materials, procedures, and evaluation techniques.
University of Regina (Canada)
University of Regina: Math Central: Basics of Graphing
Students learn the basics of graphing including terminology, plotting, and reading points. The lesson has an overview, materials, procedures, and evaluation techniques.
Alabama Learning Exchange
Alex: Connecting With Coordinates
This activity will allow young scholars to practice plotting points on a grid. Students will have an opportunity to play a coordinate game. This activity is hands-on and allows for cooperative learning. This lesson plan was created as a...
PBS
Pbs Learning Media: Locating Points on the Cartesian Graph
In this interactive, students use clues and logic to plot the location of aquatic animals on a Cartesian graph that represents the four cardinal directions. The three riddles in the interactive, including one that requires students to...
Washington State University
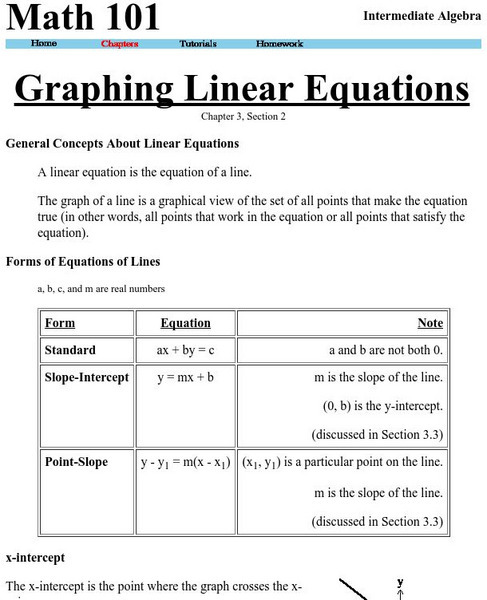
Washington State University: Graphing Linear Equations
This site explains what a linear equation is, general forms of linear equations, how to graph a line using the method of plotting points. The site also details how to find points on the line given the equation, information about the...
Other
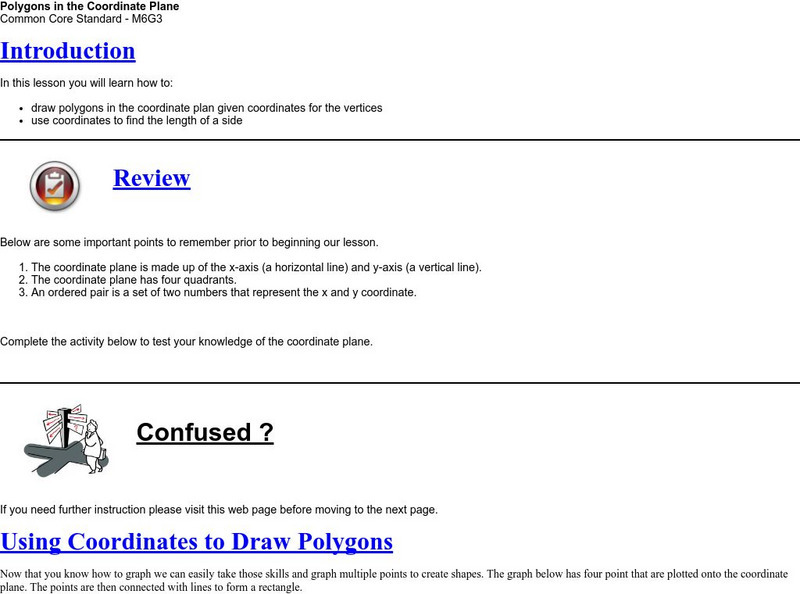
Soft Chalk Llc.: Polygons in the Coordinate Plane
This site provides short lesson reviews on how to plot points on a coordinate plane to form polygons. It also gives quick checks in between.
Duke University
Duke University: Web Feats Ii: Lessons on Regression at Hessian
This site has several lessons on regression, "Designed to help students visualize topics associated with lines of regression, given a set of data points." Go to the teacher notes to find the objectives and standards which apply.


