American Association of Physics Teachers
Com Padre Digital Library: Open Source Physics: Data Tool Program
Use this online data analysis tool to build graphs and display results from scientific investigations. Data can be entered directly with the keyboard or imported from, and exported to spreadsheets.
University of Cambridge
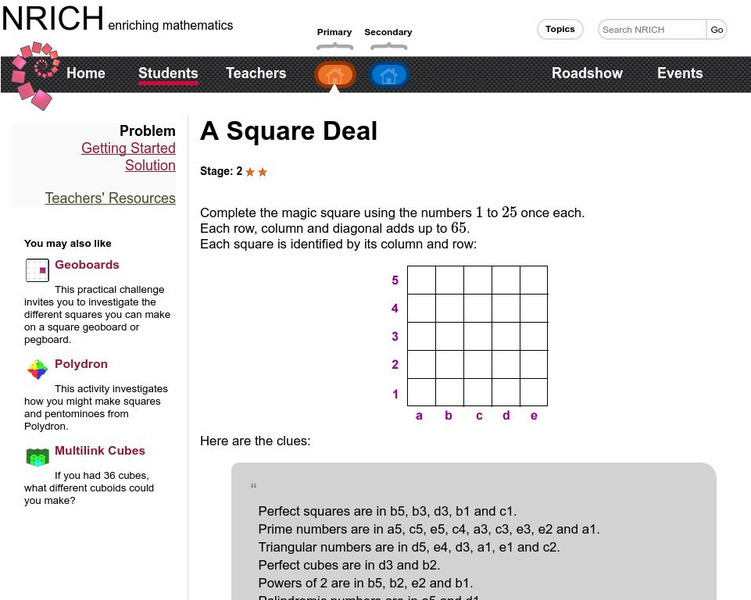
University of Cambridge: Nrich: A Square Deal
On this one page website sharpen your logic, ordered pairs, and pattern recognition skills while working on this challenge. The solution is available to double check your solution.
Visual Fractions
Visual Fractions: Identify With Lines
Use this interactive site from Visual Fractions to practice identifying numerators and denominators using a number line. You will be given a point between 0 and 1 to name as a fraction.
Oswego City School District
Regents Exam Prep Center: Regression Analysis
A collection of lesson ideas, a practice activity, and teacher resources for exploring regression analysis.
Khan Academy
Khan Academy: Histograms Review
A histogram displays numerical data by grouping data into "bins" of equal width. Each bin is plotted as a bar whose height corresponds to how many data points are in that bin.


