Hi, what do you want to do?
Texas Instruments
Texas Instruments: What Is a Linear Regression?
In this activity, students create lists of data points, plot them on a graph, and determine the regression equation of the best fitting line. They also understand exactly how the linear regression is determined.
Texas Instruments
Texas Instruments: Numb3 Rs: Dialing Ben
Based off of the hit television show NUMB3RS, this lesson has students try to discover if there has been a significant change in cell phone use over the course of ten days. If so, this "change point" can be detected by creating a line of...
Illustrative Mathematics
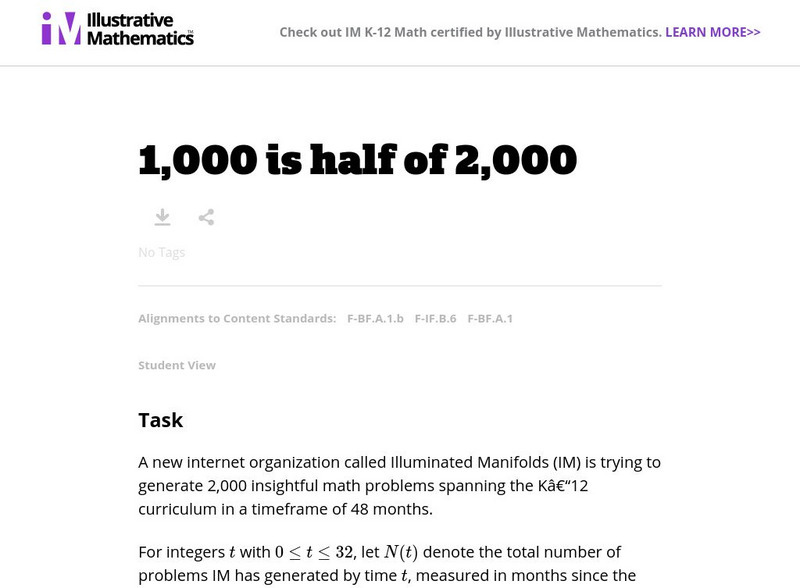
Illustrative Mathematics: F Bf 1,000 Is Half of 2,000
This task is about an online mathematics organization that is trying, over a four-year period, to generate 2,000 math problems that cover all grades. This real-life modeling task could serve as a summative exercise that draws on many...
PBS
Pbs Learning Media: Everyday Algebra Plus: Targeted Math Instruction
Algebra instructional activity focuses on using patterns and relationships to write equations with two variables to represent relationships and patterns in real-world problems, plotting ordered pairs on a coordinate grid, and...
PBS
Pbs Learning Media: Math + Arts: Symmetry, Reflective Drawing, and Totem Poles
In this lesson, students will create a colored pencil drawing utilizing symmetry and forms characteristic of Northwest Coast art and write a critique of their work. Media resources and teacher materials are included.


