Curated OER
Slopes, Slope-Intercept Form, Standard Form
Students identify the slope of an equation using various methods. In this algebra lesson, students graph linear equations and calculate the slopes using the x and y intercept to solve the equations and graph the lines. They use the slope...
Curated OER
Slope of Line
In this algebra worksheet, students calculate the slope of a line. They graph a linear equation given the slope and y-intercept and identify the slope and y-intercept given a linear graph. There are 15 questions.
Curated OER
Solving Systems of Equations by graphing for Algebra One
Students watch the teacher demonstrate on an overhead projector how to graph various equations before the students try them on their own. They start with pencil and paper; once they grasp the concept they move on to punching in the...
Curated OER
Quadratic Equation Calculator
In this Algebra II activity, 11th graders use an online quadratic equation solver to find the zeros of a quadratic. The one page interactive activity provides one worked example and the equation solver.
Curated OER
Quadratics: Vertex Form
Young scholars practice graphing quadratic equations. They work to solve and equation involving finding the vertex using given formulas. Once their points have been graphed, students determine the direction in which the angle opens....
Curated OER
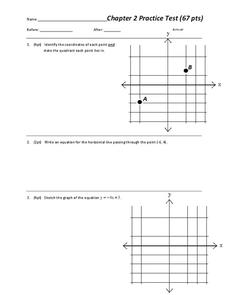
Chapter 2 Practice test
Overall, this worksheet contains a good selection of problems that reviews different aspects of linear equations. Learners examine and graph linear equations, absolute value equations, and inequalities in two variables. The three page...
Curated OER
Worksheet 7 - Asymptote
In this asymptote worksheet, students compute limits, graph vertical asymptotes, and find the slope of the secant line. This one-page worksheet contains six multi-step worksheets.
Curated OER
Linear Functions
Students solve, identify and define linear equations. In this algebra lesson, students calculate the slope and y-intercept of a line. They graph the line given two points and the slope.
Curated OER
Solving Systems by Graphing
Students solve systems of equation through graphing. In this algebra lesson, students solve linear equations and analyze the result to figure out if there is one solution, no solution or infinitely many solutions. They graph their lines...
Virginia Department of Education
Transformation Investigation
Graph it! Investigate transformations with a graphing calculator. Pupils graph sets of linear functions on the same set of axes. They determine how changes in the equation of a linear function result in changes in the graph.
Curated OER
Introductory Algebra Chapter 7 Review
In this math worksheet, students solve the problems based upon finding the slope of the linear equation lines. Each problem set has a detailed example.
Curated OER
Introducing Linear Terminology
Ninth graders graph linear equations and inequalities in two variables and then, they write equations of lines and find and use the slope and y-intercept
of lines. They use linear equations to model real data and define to define the...
Curated OER
Discovering the Linear Relationship between Celsius and Fahrenheit
Students discover the linear relationship between degrees Farenheit and degrees Celsius. They manually compute the slope and y-intercept of the line passing through points. They convert Celsius to Fahrenheit degrees.
Curated OER
Solving Systems by Graphing
In this solving systems by graphing learning exercise, 9th graders solve and complete 5 different problems. First, they change each equation to graphing form. Then, students graph each line and find their point of intersection. In...
Curated OER
Algebra II Test Sections 2.4
In this algebra worksheet, students identify the slope of a line, solve algebraic equations with absolute value, and identify the domain and range of given functions. This three-page worksheet contains 21 problems.
Curated OER
Cartesian Coordinate System
Students explore the Cartesian coordinate plane and plot points on the graph. They interpret coordinates for a point from the graph and give the ratio of rise over run for slope.
Curated OER
Whose Line is it Anyway?
Students solve systems of equations. For this algebra lesson, students identify the domain and range of each function. They use the slope and y-intercept to graph each line.
Curated OER
Linear Functions
In this linear function worksheet, learners write the equation of a line, identify the slope, distance and midpoints. This one-page worksheet contains seven problems. Answers are provided at the bottom of the page.
Curated OER
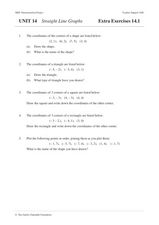
Straight Line Graphs
In this math worksheet, students plot lines on a graph paper when given the equation for the line in slope-intercept form. They tell the values of the slope and the y-intercept. Students find the x and y intercepts and plot three lines....
Curated OER
More Graphing With Intercepts
In this graphing worksheet, young scholars graph linear equations. They identify the x or y-intercept. Coordinate planes are available below each equation. Nine problems are provided on this two-page worksheet.
Curated OER
Graphing Linear Equations Using Data Tables
Learners review the Cartesian plane and the process of plotting points. In groups, students create tables, identify the slope and y-intercept, and graph the equation. Afterward, learners perform the same process, only, individually. As a...
Curated OER
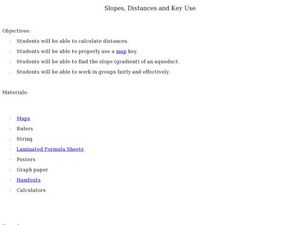
Slopes, Distances, and Map Keys
Students explore Rise and Run. In this math lesson, students use Rise and Run to find given slopes, they will use the slopes to calculate distances from point to point on graph paper.
Cornell University
Math Is Malleable?
Learn about polymers while playing with shrinky dinks. Young scholars create a shrinky dink design, bake it, and then record the area, volume, and thickness over time. They model the data using a graph and highlight the key features of...
Curated OER
Perpendicular Lines in the Coordinate Plane
Students investigate the relationship between perpendicular and parallel lines on a coordinate plane. In this geometry lesson, students differentiate lines based on their slopes.


