Texas Instruments
2B or not 2B a Functions
Learners use their graphing calculators to view graphs of equations. They tell if each equations is or is not a function and are shown pre-set graphs on their graphing calculators. They use the Quick Poll feature to indicate if the graph...
Willow Tree
Box-and-Whisker Plots
Whiskers are not just for cats! Pupils create box-and-whisker plots from given data sets. They analyze the data using the graphs as their guide.
Curated OER
What's Your Favorite Planet?
Fourth graders interpret a graph and make correlations using data. After taking a class survey, 4th graders create a class graph of their favorite planets. Working in small groups, they interpret the information and create at least ten...
Curated OER
Bird Bulletins
Students, in groups, create a survey to investigate how much their community knows about birds. They graph their findings using a bar graph. Using the data collected, they develop an advertising campaign to increase community awareness...
Curated OER
Education for Global Peace
Fifth graders construct data graphs based upon sets of data. In this graphing lesson, 5th graders read the text If the World Were a Village and discuss how types of graphs accurately represent a large population. Students construct their...
Curated OER
Civic Engagement: Community and Social Action
Explain that today's project is that students will get groups create a survey to poll their classmates on what they do to stay healthy. The results will then be shown on a bar graph.Students brainstorm ways of keeping healthy and teacher...
Curated OER
Graphs
Students list their favorite cars and create graphs of their favorites. Students determine how the graphs would change as their choices change.
Curated OER
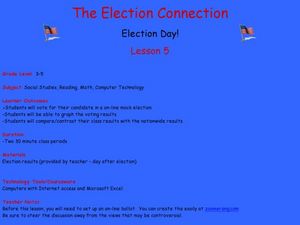
The Election Connection
Learners participate in a mock election. In this election activity, students vote online in a mock election, graph the results, and compare their results to the nationwide results.
Curated OER
Excel Lesson
Students explore data and Excel spreadsheets. They collect data about political candidates. Students enter the data into a chart on Excel. They create a graph using the data and Excel.
Curated OER
Young Voters Make A Difference
Students research recent statistics on voting by those 18 to 24. They survey senior students to determine their intent to vote in the next election. Students display the data in charts and graphs. They write the results and share it with...
Curated OER
Constitutional Amendments Survey
Students conduct Constitutional Amendments Survey to create an opinion poll forum.
Curated OER
Which Has The Most?
Young scholars are part of a class poll where they choose their favorite food and their favorite toy. In this which has the most lesson, students are given a block to represent their choice. Young scholars then place the block by...
Curated OER
And Around We Go!
Sixth graders conduct a survey and collect data to construct a bar graph that will then be changed into a circle graph. With the bar graph, 6th graders compare estimated fractions and percentages and estimate percentages. With the circle...
Curated OER
Too Free, Or Not Too Free?
Students create a survey that examines what level of electronic surveillance might be acceptable to members of the school and community. They poll the community, and analyze the results in the form of graphs and a written news article.
Curated OER
Understanding Presidential History
Students research to find the qualifications necessary to be President of the U.S. For this presidential qualification lesson, students research their family roots to see if they could qualify to be President. Students create a graph to...
Curated OER
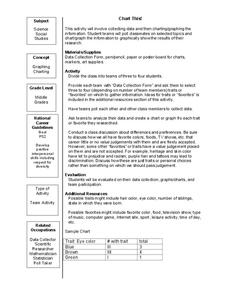
Chart This!
Students collect data and graph or chart the information. In this data organization instructional activity, students poll their classmates about certain topics and chart or graph the information to show the results of their research.
Curated OER
Do You Like to Spend or Save?
Students, after briefly discussing spending and saving habits, take a poll to see how their peers like to manage money. Then students graph their findings and discuss the survey results.
College Board
Civic Knowledge and Action in AP U.S. Government and Politics
Vote, it's your civic duty! The high school lesson focuses on voter turnout and civic participation with a series of activities. Young scholars analyze data to discover voter turnout trends, complete worksheets, and participate in group...
Curated OER
A Birthday Basket for Tia
Students practice reading and math skills using technology. In this main idea lesson, students retell the important events of A Birthday for Tia in sequence using Kid Pix. Students create a bar graph using The Graph Club...
Curated OER
Chart This!
Students collect and analyze data. In this middle school mathematics lesson, students collect data on three to four traits or favorites. Students analyze their data and create a chart of graph for each trait or favorite they...
Curated OER
The Immigrants of Brooklyn: Now And Then
Students compare the immigrant population during the pre-Civil War era (1855) to that of today (2000 census data). They interpret circle and bar graphs comparing immigrant populations in Brooklyn yesterday and today, and create a class...
Curated OER
Cell Phone Plans
Students relate the use of a cell phone to math. In this algebra instructional activity, students collect data on the usage of their phones and plot it. They analyze the graph and make predictions based on the rate per minute.
Curated OER
Visual Communication of Quantative Data
Students collect and analyze data based on academic performance. In this statistics lesson, students create graphs and analyze the data they created. They use positive, negative and no correlation to analyze the data.
Curated OER
Ball Toss Activity
Pupils collect data from tossing a ball into the air. Using a data collection device, they graph the data, set a window, and analyze the height of the toss, how long the ball was in the air, etc. They then find an equation that models...


