US Department of Commerce
Over the Hill - Aging on a Normal Curve
Nobody is too old to learn something new. Young statisticians analyze census data on the percentage of the population older than 65 years old in US counties. They fit a normal distribution to the data, determine the mean and standard...
Curated OER
Exponential Models
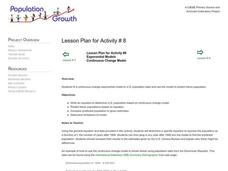
Learners fit a continuous change exponential model to U.S. population data and use the model to predict future population.
Curated OER
The Nifty Fifty-What's Your Size?
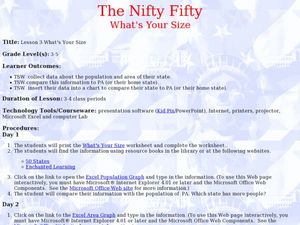
Students explore state populations. In this state geography lesson, students use a variety of technology tools to research and graph population and area of assigned states.
Curated OER
Where Do I Live?
Students gain a better understanding of the population of the region they live in by comparing U.S. census data on the internet.
Curated OER
Annual Wetland Plant Diversity Survey
Students locate an area of marsh and, by measuring the total number of individual plants in a sample area, determine whether purple loosestrife population density is correlated to the total plant diversity of the community. They...
Curated OER
Beetle Collection and Release
Young scholars investigate plants and compare them to the purple loose strife. As they observe the plants they predict possible impacts on plant populations based on their observations. They work in groups and present their findings to...
Curated OER
Modeling a Gene Pool
In this genetic activity, students examine how gene frequency changes in a population of organisms. After completing 5 pre-lab questions, they work in pairs to collect data and answer 5 additional post-lab questions.
Curated OER
Population Trends
Young scholars explore, examine and study the differences and similarities in the average ages of the populations of two countries in the EU. They interpret tables, draw and interpret diagrams and assess interpretations of a statistical...
Curated OER
Population Limits
Middle schoolers gather information on China's government controlled population limit policy, discuss the policy with their peers, mathematically model different policies, and decide as a class on the best policy.
Curated OER
Lesson Plan C22: Government and Population
Students discuss basic structure of National Government in United Kingdom, explore electoral system of individual countries and European Union, and complete Government and Population worksheet to practice rounding, and calculating mean...
Curated OER
Populism and Segregation
For this U.S. history worksheet, students read articles about Populism and segregation. Students then respond to 15 short answer questions.
Curated OER
Population: Logistically Speaking
In this population worksheet, students read word problems relating to population growth. They write the problem as a differential equation, create models and graphs of the solution. This three-page worksheet contains 10 multi-step...
Curated OER
Deer Population
Ninth graders study deer including their reproduction rate and management in Pennsylvania. In this deer overpopulation instructional activity students estimate deer population and suggest management tools.
Curated OER
Bird Populations
Students gather data about bird populations. They study bird migratory patterns using the methods that researchers use. They write an essay explaining the differences between the four types of population movements.
Curated OER
Zebra Mussel Population Simulation
Students are taught how to format and enter data into an Excel spreadsheet. They make a graph, and interpret graphed data. Students discuss the possible impacts of zebra mussels on the Hudson river. They graph zebra mussel data.
Curated OER
Connecting Cartography to Society
Older high schoolers use maps to study changes in society like migration, population loss, and economic shifts, and then connect events from historical events to present day mapping of their region (The resource focuses on Canada, but...
Curated OER
Bacteria Populations
Your young microbiologists will interpret and solve exponential equations in this real-world context task set in a hospital research scenario. Learners think in terms of the functions as well as their rates of change.
Illustrative Mathematics
Animal Populations
Assume all you know is that the variable Q represents a value that is bigger than the value represented by the variable P. Which is larger P + Q or 2P? The problems in this activity get more complex than...
Curated OER
US Population 1982-1988
Your algebra learners make predictions using the concepts of a linear model from real-life data given in table form. Learners analyze and discuss solutions without having to write a linear equation.
Curated OER
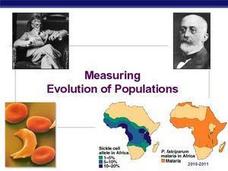
Measuring Evolution of Populations
The Hardy-Weinberg principle is the focus of this concise slideshow. Some vocabulary definitions are given on the first 2 slides, and the rest are given over to examples of the Hardy-Weinberg theorem. Calculations of the H-W...
Curated OER
Genes within Populations
Finally, here is a genetics worksheet that does not include Punnett squares! Designed for a more advanced class, biology learners will compare Lamarck's concept of evolution with Darwin's. They will explore the Hardy-Weinberg equilibrium...
EngageNY
Modeling an Invasive Species Population
Context makes everything better! Groups use real data to create models and make predictions. Classmates compare an exponential model to a linear model, then consider the real-life implications.
Curated OER
Prairie Populations
Eleventh graders practice the Quadrat Survey Technique to analyze the biodiversity of a local plant community. They compare its biodiversity with the documented changes in biodiversity of the tallgrass prairie over time.
Curated OER
AP: Chapter 54: Ecosystems
A lot of learning is packed into these 23 questions about ecosystems. Advanced biology classes apply their knowledge of communities, productivity, biogeochemical cycles, and human impact on the environment by writing short answers for...
Other popular searches
- Population Ecology
- Population Genetics
- Population Density
- Population Biology
- Population Growth
- Population Geography
- Human Population
- World Population
- Population Distribution
- Aging Population
- Populations and Ecosystems
- Human Population Growth

