Hi, what do you want to do?
Khan Academy
Khan Academy: Interpreting a Confidence Interval for a Mean
After we build a confidence interval for a mean, it's important to be able to interpret what the interval tells us about the population and what it doesn't tell us.
Khan Academy
Khan Academy: Interpreting a Z Interval for a Proportion
Once we build a confidence interval for a proportion, it's important to be able to interpret what the interval tells us about the population, and what it doesn't tell us. Let's look at few examples that demonstrate how to interpret a...
Palomar Community College District
Palomar College: Hardy Weinberg Principle
This site from Palomar College describes the conditions needed for theHardy-Weinberg Principle to hold true.Completes sample calculations involvingthis principle.
Social Science Education Consortium
Ssec: Employment Unemployment: How Can Both Rates Rise at the Same Time? [Pdf]
In this investigation, students are asked to explain a Wall Street Journal (WSJ) announcement about unemployment, and look for a contradiction in the message. Then they are introduced to the definitions of employment, unemployment, and...
TeachEngineering
Teach Engineering: Your River's Health
Students perform a macroinvertebrate survey to gauge the health of a local river. They collect water samples and count macroinvertebrates to learn how the health of a river's ecosystem can be determined by its river insect population.
Cornell University
Cornell University: Study Design Tutorial: Cross Sectional Studies
This tutorial from Cornell University's College of Veterinary Medicine explains what a cross-sectional study is, its key characteristics, how to assess events and outcomes, and some special considerations when choosing sample...
Education Place
Houghton Mifflin: Eduplace: Math Steps: What Is It? Data
This is a great place for lesson information on the concept of analyzing data - measures of central tendency. Three other tabs are available besides the "What Is It?" link. Tips and Tricks, When Students Ask, and Lesson Ideas also...
PBS
Pbs Teachers: Scientific American: Deep Crisis: Salmon Counting
In this lesson, students can explore the techniques of census and population counting by inferring numbers of a virtual population illustrated within a rectangular sampling grid, and observing the accuracy of the technique in relation to...
Illustrative Mathematics
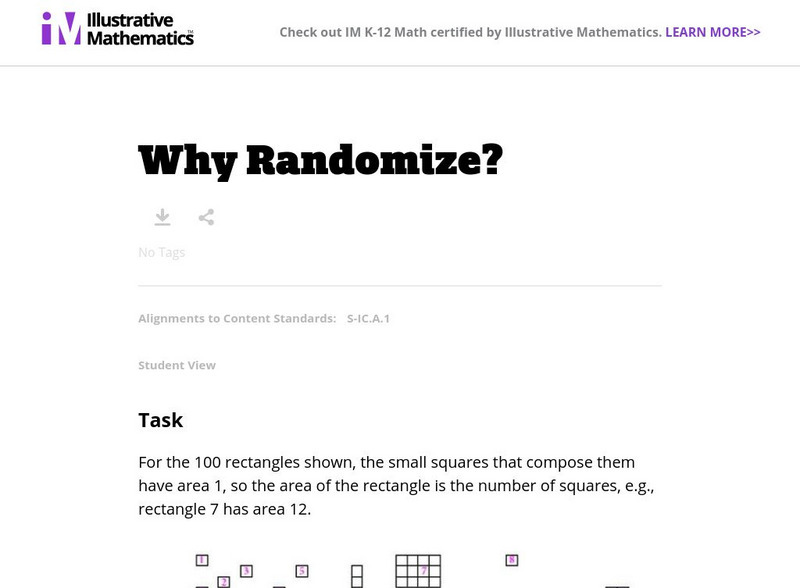
Illustrative Mathematics: S Ic Why Randomize?
The exercise demonstrates that judgment (non-random) samples tend to be biased in the sense that they produce samples that are not balanced with respect to the population characteristics of interest. Students will estimate the mean...
PBS
Pbs Teachers: Something Fishy [Pdf]
Estimate the size of a large population (fish in a bay) by applying the concepts of ratio and proportion through the capture-recapture statistical procedure.
Alabama Learning Exchange
Alex: My Peanut Butter Is Better Than Yours!
The students will engage in the process of statistical data comparing data using tables and scatterplots. The students will compare data using measures of center (mean and median) and measures of spread (range). This lesson can be done...
Web Center for Social Research Methods
Research Models Knowledge Base: Selecting Survey Method
Details the following issues that should be considered when selecting the survey method: population, sampling, questionnaire, bias, and administration.
The Wonder of Science
The Wonder of Science: Ms Ls2 1: Effects of Resource Availability
Work samples, phenomena, assessment templates, and videos that directly address standard MS-LS2-1: effects of resource availability.
Khan Academy
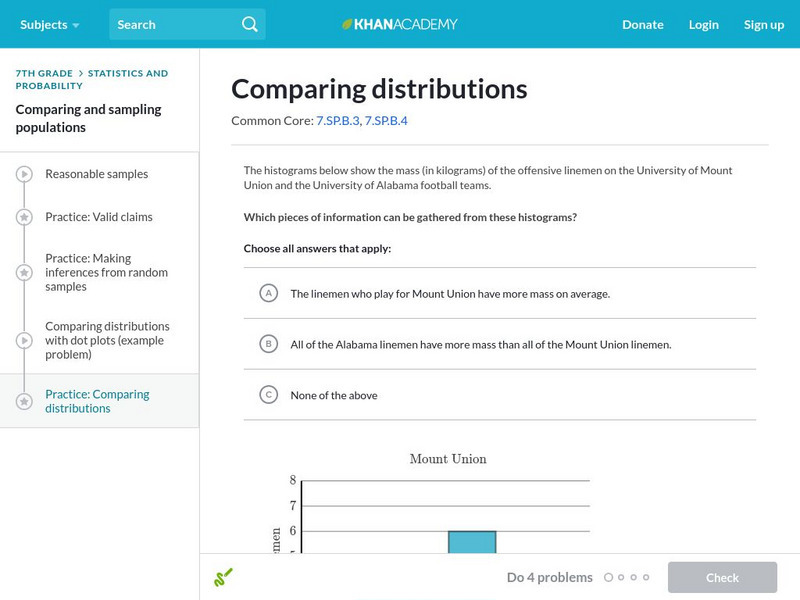
Khan Academy: Comparing Distributions
Practice comparing distributions of data in different forms of graphical representation.
Texas Instruments
Texas Instruments: Central Limit Theorem
This set contains questions regarding the Central Limit Theorem. The student sees that, as the size n increases, the shape of the sampling distribution gradually approaches a normal curve, and its population standard deviation decreases.
Texas Instruments
Texas Instruments: Numb3 Rs: Different or Not?
Based off of the hit television show NUMB3RS, this lesson has students examine cancer rates in population samples of the New England states to determine if the states' cancer rates are statistically similar. Hypothesis testing is...
Texas Instruments
Texas Instruments: Statistics Terms
This set contains statistics questions pertaining to the basic terms and definitions of statistics. The student distinguishes a population from a sample, a parameter from a statistic, and inferential from descriptive statistics.
Calculator Soup
Calculator Soup: Statistics Calculator
Calculate basic summary statistics for a sample or population data set including minimum, maximum, range, sum, count, mean, median, mode, standard deviation and variance.


![Ssec: Employment Unemployment: How Can Both Rates Rise at the Same Time? [Pdf] Lesson Plan Ssec: Employment Unemployment: How Can Both Rates Rise at the Same Time? [Pdf] Lesson Plan](https://static.lp.lexp.cloud/images/attachment_defaults/resource/large/FPO-knovation.png)


