Hi, what do you want to do?
Stefan Warner and Steven R. Costenoble
Finite Mathematics & Applied Calculus: Sampling Distributions and the Central Limit Theorem
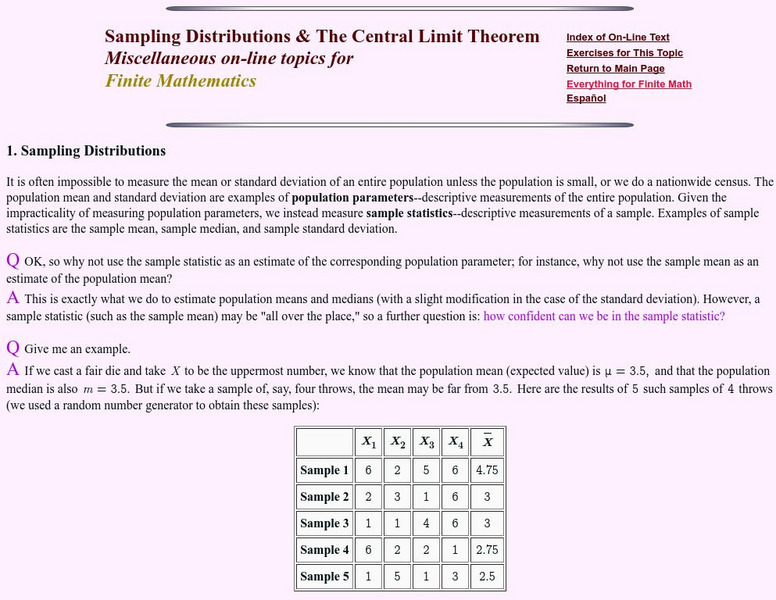
Students learn about sampling distributions and the Central Limit Theorem. Topics explored are sample mean, population mean, and using the Central Limit Theorem. The tutorial investigates the statistics concepts through class notes and...
Science Education Resource Center at Carleton College
Serc: Nature of the Chi Square Distribution
Students learn that statistical distributions, such as the normal, Student's t, chi-square and F distributions are interrelated. They will explore these relationships and discover equivalent statistical tests that can used in specific...
Texas Demographics Center
Office of the State Demographer: Introduction to Migration in Texas [Pdf]
A report explaining the factors that cause a population to increase, as has been the case in Texas, why migration takes place and why it is important, and the contributions of immigrants to Texas. The focus is on population changes...
Royal British Colombia Museum (Canada)
Italians in British Columbia
The Royal British Columbia Museum discusses the role that Italians played in shaping the province. Italian workers were instrumental with the gold rush, with coal mines and with the construction of the railroad. The Italian Community...
Georgia Department of Education
Ga Virtual Learning: Introduction to Epidemiology
In this comprehensive interactive tutorial you will not only learn what epidemiology is but you will also learn the role of epidemiology in public health practice. Also, you will explore the history of epidemiology to understand how its...
Association of Religion Data Archives
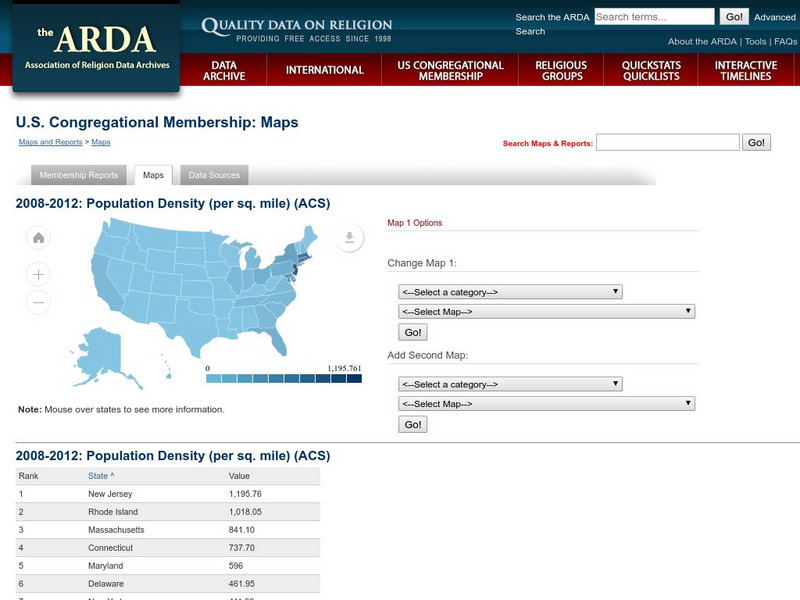
Association of Religion Data Archives: u.s. Population Density Map
Interactive tool that lets you choose a map (Census or Religion), then choose demographic or religious profiles to create a slideshow.
Science Education Resource Center at Carleton College
Serc: Reese's Pieces Activity: Sampling From a Population
Students use Reese's Pieces to investigate the proportion of orange candies present in a set of 25. After collecting data for the class, they use a web applet to collect more data for random samples. This is compared to the actual...
Alberta Online Encyclopedia
Alberta Online Encyclopedia: Alberta's Estonian Heritage
Over the years, many immigrants came to Alberta from Estonia. This site profiles the rich history, areas of settlement, sense of community as well as the Estonian people and their cultural life.
US Census Bureau
U.s. Census Bureau: Age Data
This website has data available on age at the following levels: National, State, County, and other. Other statistical sections are "International Data," "Baby Boomer," "Older (55+) Population," and "Elderly (65+) Population."
TeachEngineering
Teach Engineering: The Great Divide
In this activity, students will use cookies to simulate the distribution of our nonrenewable resources (energy). Then, they will discuss how the world's growing population affects the fairness and effectiveness of this distribution of...
TeachEngineering
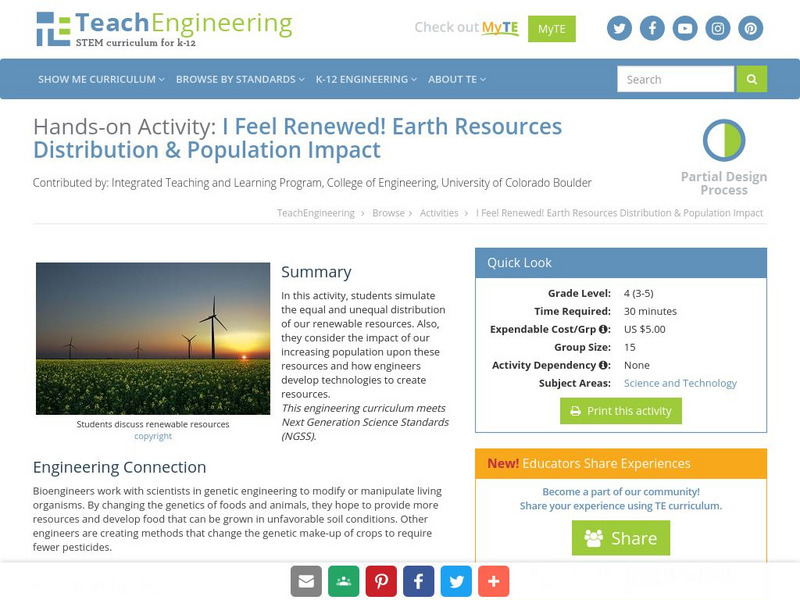
Teach Engineering: I Feel Renewed!
In this activity, students will simulate the equal and unequal distribution of our renewable resources. Also, they will consider the impact of our increasing population upon these resources and how engineers develop technologies to...
Discovery Education
Discovery Education: African American Population Shifts
After completing this mini-unit, students will understand some of the economic, educational, and lifestyle reasons why African Americans have moved from one place in the United States to another.
Other
My Science Box: Ecosystem Organization
In this lesson, learners will learn about the different levels in the hierarchy of ecology and explain the relationships: organism, population, community, ecosystem, biome, and biosphere. They will also discover why different regions...
University of Cambridge
University of Cambridge: Maths and Sports: Who's the Best?
Can you use data from the 2008 Beijing Olympics medal tables to decide which country has the most naturally athletic population? This data-handling activity encourages mathematical investigation and discussion and is designed to be...
Illustrative Mathematics
Illustrative Mathematics: S Id.4 Should We Send Out a Certificate?
Should Fred receive a certificate for scoring in the top 2.5% of a statewide standardized test? Given the test scores for a large population and the mean and standard deviation, students will decide if Fred's score is good enough....
CK-12 Foundation
Ck 12: Algebra Ii: 5.4 Standard Deviation
Explore what the standard deviation is as it relates to the graph of a normal distribution curve.
Curated OER
Etc: Maps Etc: Distribution of Population , 1850
A map of the United States showing the population distribution in 1850. The map is coded to show population densities ranging from under 2 inhabitants per square mile to over 90 inhabitants per square mile. The map illustrates the...
Curated OER
Educational Technology Clearinghouse: Maps Etc: North America, Population, 1911
A map from 1911 of North America, Central America, Greenland, and the Caribbean to Puerto Rico showing the population distribution at the time. The map is color-coded to show population densities from under 2 persons per square mile to...
Curated OER
Etc: Maps Etc: Density of Population in the u.s., 1901
A map from 1901 of the United States showing the population distribution at the time. The map is keyed to show areas of population densities ranging from sparse to very dense. This map is part of a classroom map study illustrating how,...
Curated OER
Etc: Maps Etc: Population of North America, 1898
A map from 1898 showing the population distribution of North America, Central America, and Caribbean to Puerto Rico. The map shows areas of sparse to heavily populated concentrations at the time. "Many thousands of white men from western...
Alberta Online Encyclopedia
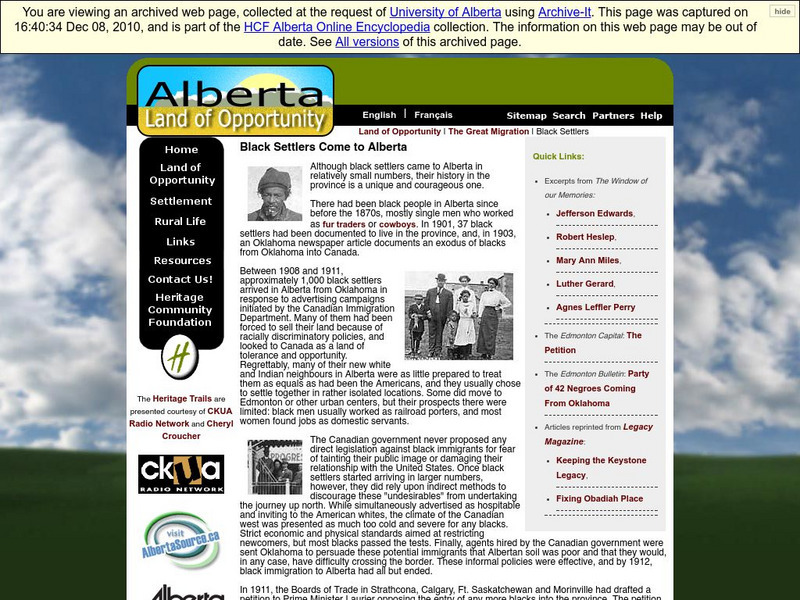
Alberta Online Encyclopedia: Black Settlers Come to Alberta
A brief overview of the immigration and settlemnent of Black populations in Alberta.
Columbia University
Nasa: Sedac: Applications of Satellite Remote Sensing
[Free Registration/Login Required] A collection of twenty-eight data sets from SEDAC (Socioeconomic Data and Applications Center) that examine ways in which remote sensing by satellites gives us useful information about the world....
Other
Canadian Centre for Energy Information: Canada Fueled by Resources [Pdf]
In this teaching unit for Grades 4 and 5, students learn about Canada's petroleum resources, the impact on the environment from our use of them, and how the geography Of Canada affects things like population distribution and regional...
Other
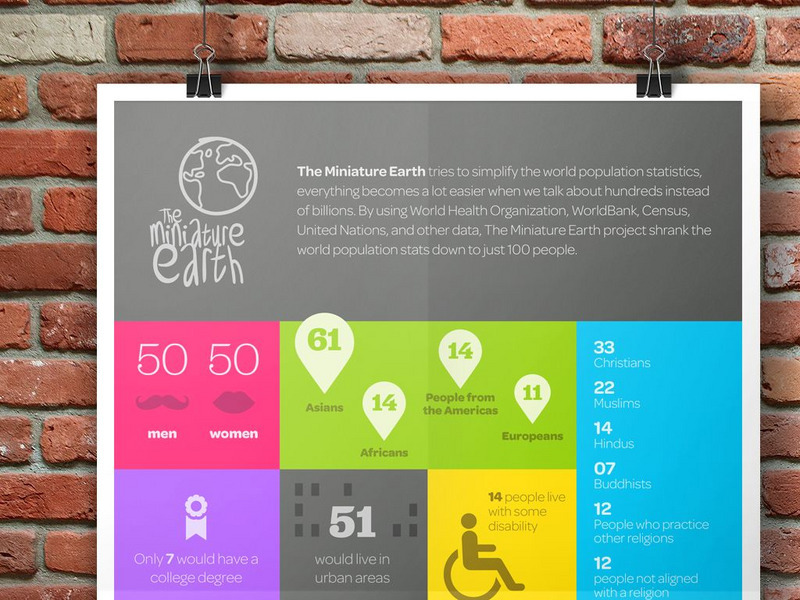
Miniature Earth: Comparative Demographics Worldwide
Miniature Earth reduces the world's population to 100 to underscore the dramatic differences in wealth, age, faith, education, environment, and health among people who live on this planet. An excellent apply-what-you-know site for...



![Office of the State Demographer: Introduction to Migration in Texas [Pdf] Article Office of the State Demographer: Introduction to Migration in Texas [Pdf] Article](http://lessonplanet.com/content/resources/thumbnails/410028/large/bwluav9tywdpy2symdiwmduymc0zmdm4ny1xbnb6bzeuanbn.jpg?1589984930)


