Hi, what do you want to do?
Other
Vancouver Aquarium: Harbor Seals
Are harbour seal populations endangered? What role does the harbour seal play in the ecosystem? How does the harbour seal reproduce? Find the answers to these questions and more in this enlightening site.
Other
Canada: Thematic Maps
At this site find examples of thematic maps from the Canadian census. "A thematic map shows the spatial distribution of one or more specific data themes for standard geographic areas."
Other
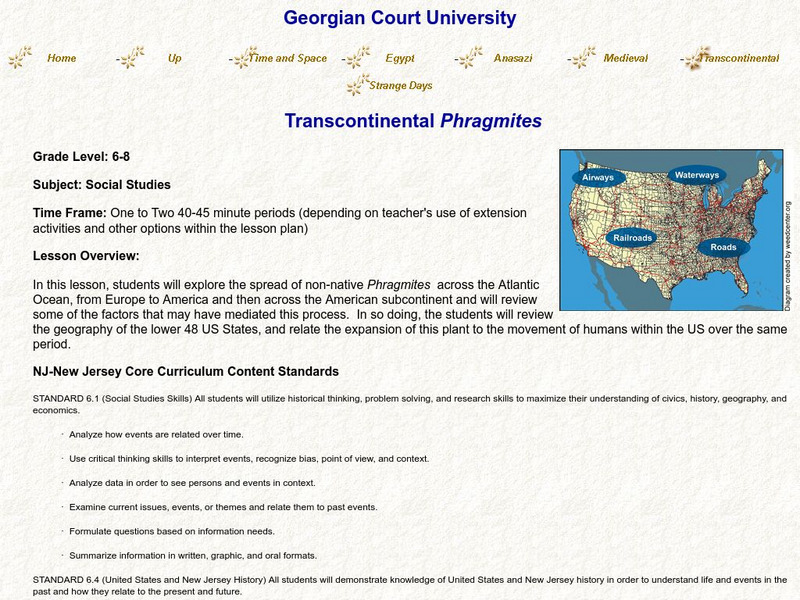
Transcontinental Phragmites
For this lesson, young scholars will examine the spread of Phragmites, an invasive species, across the Atlantic from Europe to the United States, and look for connections to human navigation patterns, while applying their knowledge of...
Curated OER
Educational Technology Clearinghouse: Maps Etc: Distribution of Population, 1820
A population map of United States and territories in 1820 showing the distribution of the European-American population at the time and the general tribal lands of the Native Americans east of the Mississippi River. The map shows the...
Curated OER
Educational Technology Clearinghouse: Maps Etc: Distribution of Population, 1830
A population map of United States and territories in 1830 showing the distribution of the European-American population at the time and the general tribal lands of the Native Americans east of the Mississippi River. The map shows the...
Curated OER
Educational Technology Clearinghouse: Maps Etc: Distribution of Population, 1880
A map of the United States showing the distribution of the population in 1880. The map is keyed to show areas of population with densities ranging from under 2 inhabitants per square mile to 90 and over inhabitants per square mile.
Curated OER
Educational Technology Clearinghouse: Maps Etc: Distribution of Population, 1790
A map of the original thirteen States in 1790 showing State lines, territories northwest and south of the Ohio River, British and Spanish possessions, and the distribution of the European-American population east of the Mississippi River...
Curated OER
Etc: Maps Etc: United States Population Density, 1900
A map from 1912 of the United States, subtitled "Distribution of Population and Railways in 1900" showing the increase in population and expansion of the railroad network since 1850. The map is color-coded to show population densities...
Curated OER
Educational Technology Clearinghouse: Maps Etc: American Population, 1790
A map of the original thirteen States in 1790 showing the distribution of the European-American population at the time and the general tribal lands of the Native Americans east of the Mississippi River. The map shows the State lines,...
Curated OER
Etc: Maps Etc: United States Population Density, 1850
A map from 1912 of the United States, subtitled "Distribution of Population and Railways in 1850." The map is color-coded to show population densities ranging from areas with fewer than 2 inhabitants per square mile to areas of 90 or...
Curated OER
Educational Technology Clearinghouse: Maps Etc: Population Density of Asia, 1910
A map from 1910 showing the political boundaries and the distribution of population density of Asia at the time. This map uses gradated shading to shows areas of population densities ranging from under 2 inhabitants per square mile to...
Curated OER
Etc: Maps Etc: North American Population Density, 1910
A map from 1910 of North America, Central America, Greenland and the Caribbean showing population density distribution in the region at the time. The map is coded to show areas of population densities ranging from less than 1 inhabitant...
Curated OER
Educational Technology Clearinghouse: Maps Etc: Population, 1840
A map of the central and eastern United States in 1840 showing the distribution of the population in the region at the time. The map shows State lines, the frontier line in 1840, and is keyed to show the areas of population density...
Curated OER
Etc: Maps Etc: Population in the United States, 1900
A map from 1910 of the United States showing the distribution of the population in 1900. The map is keyed to show areas of population with densities ranging from under 2 inhabitants per square mile to 90 and over inhabitants per square...
Curated OER
Educational Technology Clearinghouse: Maps Etc: Population Density, 1910
A map of the United States showing the distribution of the population in 1910. The map is keyed to show areas of population with densities ranging from under 2 inhabitants per square mile to 90 and over inhabitants per square mile. The...
Curated OER
Etc: Maps Etc: Population Density From the First Census, 1790
A map of the eastern United States in 1790 showing the western extent of the territories to the Mississippi, and the distribution of European-American population at the time. The map is keyed to show areas of population densities ranging...
Curated OER
Etc: Maps Etc: European Population Density, 1916
A 1916 map showing the distribution of population in Europe as inhabitants per square mile.
Curated OER
Etc: Maps Etc: Distribution of Ethnicities in the United States, 1900
A map from 1907 of the United States showing concentrations and distribution of various European ethnic groups in 1900. The map is color-coded to show foreign populations where 8 percent or more of the inhabitants are Scandinavian,...
Other
Cis: Shaping Texas: The Effects of Immigration, 1970 2020
Examines trends in immigration to Texas in the decades from 1970 on, and the impact on the population of various regions and cities in Texas. Written in 1995, the projections it offers are for 1995-2020. The article also looks at how...
Illustrative Mathematics
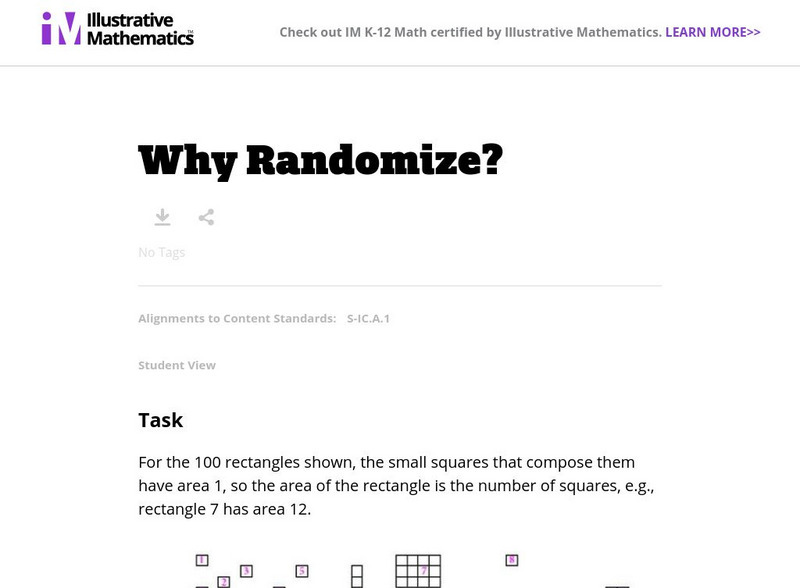
Illustrative Mathematics: S Ic Why Randomize?
The exercise demonstrates that judgment (non-random) samples tend to be biased in the sense that they produce samples that are not balanced with respect to the population characteristics of interest. Students will estimate the mean...
Other
Texas Wide Open for Business: Overview of the Texas Economy [Pdf]
From the Office of the Governor Economic Development and Tourism, this document provides a snapshot of the Texas economy. It reports on employment data, population demographics, real estate values, industries, trade, etc. from 2015.
Countries and Their Cultures
Countries and Their Cultures: Tropical Forest Foragers
The term "tropical-forest foragers," or "pygmies," refers to ethno-linguistically diverse peoples distributed across the forested regions of Central Africa who are particularly short in stature and who traditionally have lived by...
BBC
Bbc: Gcse Bitesize: Adaptations, Interdependence and Competition Aqa
The abundance and distribution of organisms in an ecosystem is determined by biotic and abiotic factors. Animals and plants have adaptations to allow them to compete for resources.


