Curated OER
Graphing and the Coordinate Plane
Students gain practice reading coordinates and plotting points by participating in the Coordinates! Game. They demonstrate and test their skills with graph paper and the Maze Game.
Curated OER
Lesson #20 Rates of Change and Velocity
Students investigate speed. In this rate of change lesson, students complete a rate/time/distance table to determine the average m.p.h. of a given trip. They listen and follow along with the lecture and examples to determine the average...
Curated OER
Quiz: Weather Prediction
In this science worksheet, 3rd graders will focus on the weather. Students will respond to ten fill in the blank questions regarding weather prediction.
Curated OER
Line of Best Fit
Students identify the line of best fit. In this statistics activity, students collect and analyze data. They calculate the regression equations and identify the different types of correlation.
Curated OER
To Be Linear or Not to be Linear, That is the Question
Students use their knowledge and understanding of equations of lines to explore independent and dependent variables. They determine how to isolate a variable and how to predict data points not represented in data.
Curated OER
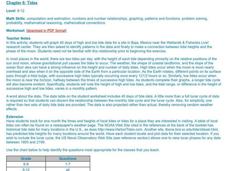
Tides
Learners graph 40 days of high and low tide data for a site in Baja, Mexico near the Wetlands & Fisheries Live! research center. They identify patterns in the data and finally to make a connection between tidal heights and the phase...
Curated OER
Twenty-Eight Multiple Choice No Calculator Allowed AP Calculus BC Practice Exam
In this AP Calculus BC practice exam, students solve twenty-eight multiple choice problems without the use of a calculator. This worksheet should be completed in fifty-five minutes.
Curated OER
AP Calculus Practice Exam
In this Calculus worksheet, students are provided with problems of a similar nature to those on their exam. Problems include limits, derivatives, and integrals. The four page worksheet contains twenty-eight problems. ...
Curated OER
Amazing Consistent Ratios
Learners derive the six trigonometric identities. For this trigonometry lesson, students find the ratios of sine, cosine and tangent using the right triangle. They use properties of the Pythagorean Theorem to find the trig identities.
Curated OER
Mathematical Modeling and constant Rate Equations
In this rates worksheet, students solve five story (word) problems related to rate and time. In two of the problems students are directed to create a graph of the problem.
Curated OER
My Peanut Butter is Better Than Yours!
Students explore the concept of statistical data. In this statistical data instructional activity, students read an article about the dangers of peanut butter to those who are allergic. Students perform a taste test of two different...
Curated OER
Demand and Supply Worksheet
In this economics principles learning exercise, students use their problem solving skills to respond to 8 questions about supply and demand.
Curated OER
Cartesian Coordinate System
Students research the Cartesian Coordinate System and its many uses in the world of mathematics and algebra.
Curated OER
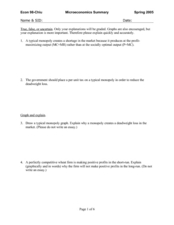
Microeconomics Summary
Twelfth graders study microeconomics. In this Economics lesson, 12th graders draw graphs on government taxes. Students decide if these graphs are true or false.
Curated OER
Viewing Tubes
Middle schoolers complete a lab in order to discover if the length of a viewing tube, its diameter, or the distance from an object affect the type of data collected and the resulting graph.
Curated OER
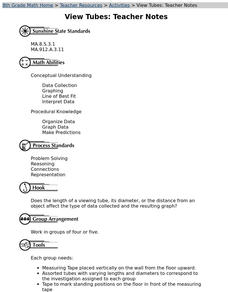
View Tubes
Eighth graders decide if the length of a viewing tube, its diameter, or the distance from an object affects the type of data collected and the resulting graph through a series of experiments.
Curated OER
Lesson #67 Relative Extrema
Students test for relative extrema. In this Calculus lesson, 12th graders investigate the relative extrema of a function and sketch the curve from the given information without the use of a calculator.
Curated OER
Investigation of Hooke's Law Lab
Students determine the spring constant by conducting an investigation. In this physics lesson, students collect data and create a graph of force vs. displacement. They compare the results of two different methods to find spring constant.
Curated OER
The Magic School Bus Goes to Mussel Beach
Students participate in a hands-on activity where they explore tidal zones. They explore tides and marine life. This is an experiment that can be accomplished in class.
Curated OER
Fitting a Line to Data
High schoolers work together in groups to collect data in relationship to how much water marbles can displace. After the experiment, they use the data to identify the linear equation to determine the best-fit line. They use the...
Curated OER
Points in a Complex Plane -- Lecture
Learners review plotting points on a coordinate plane. Individually, they add and subtrace complex numbers and graph them in a complex plane. They follow along a worksheet while their teacher lectures on the new material and solve...
Curated OER
Points in the Complex Plane -- Lab
Students review the lecture portion of this lesson. Individually, they graph various points on a complex plane and identify conjugates based on their location on the graphs. They complete a worksheet and review their answers to end the...
Houghton Mifflin Harcourt
Harcourt: School Publishers: Positive Slope
Contains one example of a line with a positive slope. Included is the equation for the line and a definition of a positive slope.
Purple Math
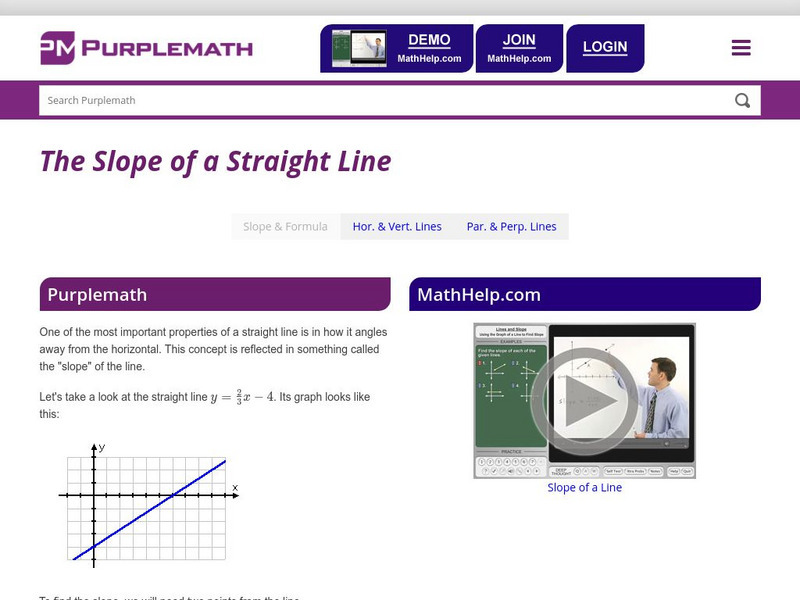
Purplemath: Slope of a Straight Line
This lesson on slope explains the slope concepts, demonstrates how to use the slope formula, shows how to find slope in horizontal and vertical lines, and how to use slope to find whether the lines through the pairs of points are...


