Curated OER
Energy Consumption
Students investigate the power consumption of household objects by using a classification sheet. In this energy conservation lesson, students read through a list of household items and tools and organize them by predicting which...
Curated OER
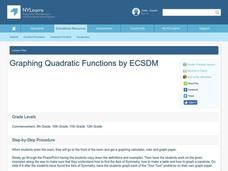
Graphing Quadratic Functions
Students graph quadratic functions. In this algebra lesson, students identify the vertex and intercepts of a quadratic equations and graph the parabola. They find the axis of symmetry and make a table to find the values of the parabola.
Curated OER
Slope of a Line
Students identify the slope of a line. In this algebra lesson, students discover the process of how to find the slope of a line and classify the slope as positive, negative, zero or undefined. They find the slope of a line given two...
Curated OER
Angles in Art
Students utilize their handheld and the Angles program to create a non-objective artwork. Images created by famous artists who have utilized angles in their art work are examined.
Curated OER
Factoring Trinomials
Students factor trinomials. In this algebra lesson, students use special patterns and formulas to factor. They utilize algebra tiles as a hands-on method for gaining practice with trinomials.
Curated OER
Squares to Compare
Students investigate how to draw and classify two and three dimensional figures (squares, triangles, rectangles.)
Curated OER
Subtraction two-digit
Second graders identify two-digit numbers, learn value of giving, solve two-digit subtraction problems, and experience giving.
Curated OER
Travel Time
Students use a migration map to estimate the distance traveled by a bird while migrating south. After calculating accurate estimates of the distance traveled, students compare the distances traveled with the amount of time elapsed.
Curated OER
Urban Changes
Pupils explore how landscapes undergo constant changes with urban development. They plan and build their own "city" by including features that have minimal resource demands to sustain the city itself.
Curated OER
Candy is Dandy
Students investigate color distribution in bags of M&Ms They sort and classify the contents of a bag of M&Ms and summarize their findings on a worksheet. Students convert the numbers into charts and make predictions about color...
Curated OER
Bias in Statistics
Students work to develop surveys and collect data. They display the data using circle graphs, histograms, box and whisker plots, and scatter plots. Students use multimedia tools to develop a visual presentation to display their data.
Curated OER
Equivalent Fractions
Students read, "TheDoorbell Rang" by Pat Hutchins and relate this story to a time when they had to share something equally between friends or family members. They then complete a worksheet in which they represent sharing situations using...
Curated OER
Playground Zoom
Learners observe and draw small objects on the playground or in the classroom with and without a magnifying glass. They explore how lenses can affect the way that an object is observed from afar or remotely sensed. Afterwards, they share...
Curated OER
How Wet Did It Get?
Students measure the rainfall/snowfall on the playground on a rainy/snowy day with a rain/snow gauge. They draw a bar graph representing the amount of water that fell and observe a satellite image of the clouds and local weather system...
Curated OER
Science and the Envrionment
Middle schoolers utilize a digital camera to record interesting objects in their environment. In this ecology lesson plan, students participate in a mini-field trip around their campus as they take 2-3 pictures of the school...
Curated OER
Plane Figures
Fifth graders create polygons requested by their teacher. In this polygons lesson, 5th graders watch a video and listen to a song about polygons. Then, students take turns labeling various polygons and practice making polygons.
Curated OER
The Coyote Population: Kansas Prairies
Students discover animal lifestyles by researching their ecosystem. In this animal statistics lesson, students research the geography of Kansas and discuss the reasons why wild animals survive in the open Kansas fields. Students complete...
Curated OER
Compass Designs
Learners investigate the properties of two and three dimensional objects. In this geometry lesson, students differentiate polygons based on similarity and congruence. They make observation and interpret the data.
Curated OER
Lesson Exchange: Polygons (Middle, Mathematics)
Pupils discover the relationship between the sides of a polygon and the number of diagonals that can be drawn from one vertex, the number of triangles that those diagonals form, and the sum of the interior angles of that polygon.
Curated OER
SOS: Save Our Ski Slopes
Young scholars defend downhill skiing as an Olympic Games event by creating a presentation that graphically proves the economic impact and popularity of this event.
Curated OER
Business Ownership
Students should identify and define the three basic forms of private business ownership.
Curated OER
Relationships in Geometry
Pupils show the correlation between quadrilaterals, parallelograms, rectangles and squares.
Curated OER
Slide Show Review
Seventh graders create a five question slide show which reviews the chapter or unit they have just completed in class. They create multiple choice questions based on the review material.
Curated OER
Calculator Addition
First graders work with calculator to add, create an addition number sentence, and plug the number sentence into the calculator and get an answer.
Other popular searches
- Powerpoint Math Lessons
- Jeopardy Powerpoint Math
- Powerpoint Math Facts
- Free Powerpoint Math Lessons
- Powerpoint Math Patterns
- Powerpoint Math 2nd Grade
- Powerpoint Math Fractions
- Powerpoint Math Proportions
- Powerpoint Math Equations
- Powerpoint Math Properties
- Powerpoint Math Lessons 8.2d
- Powerpoint Math Graphs


