Curated OER
Matrix Operations
Two real-world activities to practice adding, subtracting and multiplying matrices to problem solve. Data from several Pro football quarterbacks is used in one activity to make some predictions based on their stats. Then the class takes...
Curated OER
Beary O'Mometer Learns About Careers In Meteorology
Students explore the field of meteorology. In this meteorology lesson, students explore weather-related careers as they research the field of study as well as various weather concepts. Students interview meteorologists, write business...
Curated OER
Human Fingerprints: No Two The Same
Students will be offered numerous opportunities to further enhance their observational skills as well as the integration of math with their continual exposure to the metric system, measurement, and graphing to represent their data....
Curated OER
Measures of Central Tendency
Students analyze data using central tendencies. In this statistics lesson, students collect and analyze data using the mean, median and mode. They create a power point representing the different measures of central tendency.
Curated OER
How Do You Get to School?
Third graders talk about all the various ways they get to school. They make a list of all the bus numbers that the students use. They also list all the other methods of transportation used and solidify a hypothesis.
Curated OER
Order of Operations
Sixth graders are introduced to the concept of the orders of operations. The skills of using exponents are needed before trying the new concept. Students can be separated in groups for scaffolding.
Curated OER
Probability and Applications of Simulations
Middle schoolers apply properties of probability to the real world. In this probability lesson, learners simulate the construction of empirical distribution. They collect and analyze data using central tendencies.
Discovery Education
Sonar & Echolocation
A well-designed, comprehensive, and attractive slide show supports direct instruction on how sonar and echolocation work. Contained within the slides are links to interactive websites and instructions for using apps on a mobile device to...
Curated OER
Learning and Population Information - Where I Live
Students study their county populations in a multimedia presentation format. In this populations lesson, students work in groups of 3 to research the county populations in their state. Students chart their results in an Excel document...
Curated OER
Phenomenal Weather-Related Statistics
Eighth graders research, collect and interpret data about weather statistics. They record that data on spreadsheets. they create Powerpoint presentations on their individual or group research.
Curated OER
PASS the Arts
Learners explore math and art concepts, create digital art examples of the concepts, and incorporate these works into a PowerPoint portfolio with explanation and analysis.
Curated OER
Goobers. Goobers? Goobers!
Students begin the lesson by noting the many ways in which to use peanuts. In groups, they use the internet to research the work of George Washington Carver. They discover the allergies and nutritional information of the peanut and...
Curated OER
Remembering Our Veterans Data Management Project
Seventh graders utilize data collected from various sources based on Canadian military statistics to consolidate their understanding of data management. Students plan and create a PowerPoint presentation using this data including in...
Curated OER
Chaos and Fractal Applications
Eighth graders identify the different applications of fractals. In this math lesson, 8th graders use graphing calculator to solve algorithms. They explain how changing parameters and initial conditions affect the solutions.
Curated OER
Introduction To Data Analysis
Seventh graders investigate the concept of looking at the data put in a variety of ways that could include graphs or data sets. They analyze data critically in order to formulate some sound conclusions based on real data. Students graph...
Curated OER
Timeline - Curriculum Connections
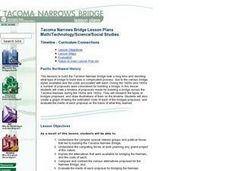
Middle schoolers research a timetable for the building of the Tacoma Narrows Bridge. After the research is completed, students construct a graph and come up with different proposals for the building of the bridge.
Curated OER
Review for the Algebra One SOLs
Students review the standards for Algebra I. Using the text, they discover two problems that match each standard and solve them showing all steps on paper. They create a PowerPoint slide for each problem and go through the correct...
Curated OER
Butterfly Adventure
Students in second grade are paired with fifth grade computer research buddies. They observe the characteristics of caterpillars, and identify the four stages of the caterpillar to butterfly life cycle. They graph the number of...
Curated OER
Kids Conserve? Water Preserved
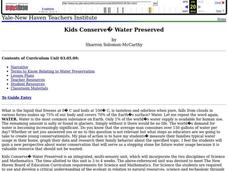
Students study conservation and how cities obtain their water. In this water lesson plan students view a PowerPoint presentation and draw a picture of the water cycle.
Curated OER
Small Business
Students simulate owning and running a small business by playing Lemonade Stands. They play the game for three weeks, then work with a partner to produce a Power Point presentation which would be given to a Board of Directors showing...
Curated OER
Exploring Quadratic Equations
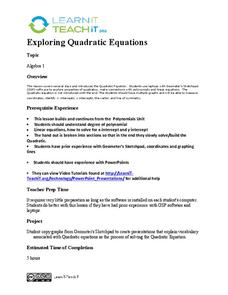
Eleventh graders explore quadratic equations. In this Algebra II lesson, 11th graders use Geometer’s Sketchpad to explore the properties of quadratics and the connections with polynomials and linear equations. The lesson is...
Curated OER
Lesson Exchange: Design and make Cents (Elementary, Mathematics)
Sixth graders work in teams to design the perfect bedroom. The teams must create a room that is functional, original, and stays within a budget of $650.
Alabama Learning Exchange
Investigating School Safety and Slope
Learners investigate the slope of various stairways through a "news report" approach and employ mathematical knowledge of applied slope to report on wheelchair accessibility and adherence to Americans with Disabilities Act. They...
Curated OER
Multiplication & Division with Arrays
Third graders work with fact families using the commutative property, arrange arrays with manipulatives, and multiply and divide symbolically with numbers.


