Curated OER
Open-Ended Problem Solving - Math
If you are looking for an end-of-the-year math assessment, then this activity could be for you! Your mathematicians are assessed on their ability to solve difficult, multi-step word problems that take quite a bit of thought and...
Curated OER
Graphing Systems of Inequalities
Solve equations and graph systems of inequalities. Designed as a lesson to reinforce these concepts, learners revisit shading and boundaries along with solving linear inequalities.
Curated OER
Solving Inequalities and Graphing on a Number Line
Students review solving equations. They solve an inequality and discuss how to graph it. Students work together on one inequality and then graph two on their own. This lesson contains links to a PowerPoint and a worksheet.
Curated OER
Graphing Ordered Pairs On A Coordinate Plane
Sinking ships, construction paper, coordinate planes, sounds like fun day in math class. Play the game Battleship with your class and reinforce the concept of graphing ordered pairs.
Curated OER
da Vinci: Body Proportion Theories
Middle schoolers investigate the validity of da Vinci's proportion theory by recording human measurements on scatter plots. In groups of three, they record each other's height and wingspan to create a Powerpoint presentation, chart, or...
Kenan Fellows
Math Made Simple as 1-2-3: Simplified Educational Approach to Algebra
Writing an equation of a line is as easy as m and b. A lesson plan presentation gives individuals different strategies for writing equations of lines. Some items provide a slope and a point while others provide two points. Whatever the...
Curated OER
Interpreting Line Graphs
Fifth graders interpret line graphs. In this graphing lesson, 5th graders first begin by reviewing the difference in bar and line graphs and what they are used for. Students practice interpreting the data on various line graphs and using...
Curated OER
Graphing at all Levels: It's a Beautiful Thing!
Mixing math and art is done in this lesson by applying graphing knowledge to create a unique piece of art. This lesson varies acording to the graphing knowledge of the artist. First, learners identify and review various types of graphing...
Curated OER
Counting Coins
Second graders identify a quarter, dime, penny, nickel, and dime. They match the coin with it's monetary value, collect data on excel spreadsheet, and create a graph in Excel. Students participate in group activities.
Curated OER
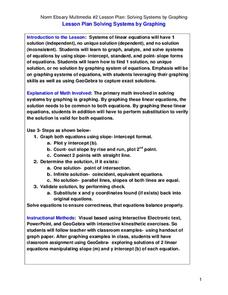
Solving Systems by Graphing
Students solve systems of equation through graphing. In this algebra lesson plan, students solve linear equations and analyze the result to figure out if there is one solution, no solution or infinitely many solutions. They graph their...
Curated OER
Using Excel To Teach Probability And Graphing
Students engage in the use of technology to investigate the mathematical concepts of probability and graphing. They use the skills of predicting an outcome to come up with reasonable possibilities. Students also practice using a...
Curated OER
Using Excel to Reference and Graph Live Data from a Web Site
Middle schoolers collect live buoy data about water temperatures in the Gulf of Mexico from the Internet and work individually to organize their data and create a line graph using Excel Spreadsheet. Students analyze their data and...
Curated OER
Graph Related Linear Inequalities
Young scholars explore the concept of linear inequalities. In this linear inequality instructional activity, students graph linear inequalities using Microsoft Excel.
Mathematics Assessment Project
Representing Functions of Everyday Situations
Functions help make the world make more sense. Individuals model real-world situations with functions. They match a variety of contexts to different function types to finish a helpful resource.
NOAA
Tracking a Drifter
Be shore to use this drifter resource. The third installment of a five-part series has learners using the NOAA's Adopt-a-Drifter website to track to movement of a drifter (buoy) in the ocean. Graphing the collected data on a map allows...
Curated OER
Graphing Ordered Pairs
Seventh graders investigate the concept of ordered pairs as found in Algebra. They are introduced to the data set that corresponds to the coordinate system. Also students practice the graphing the ordered pairs using the x and y axis.
Curated OER
Multiplying With Nine As A Factor
Elementary math minds complete various activities to memorize the multiples of nine. They watch a PowerPoint presentation and demonstrate the finger trick. Unfortunately the link to the multiplication activities does not take you...
Curated OER
Time/Elapsed Time
Young mathematicians complete various activities to demonstrate proficiency in telling time and identifying elapsed time. They analyze and discuss television schedules, create a booklet about their daily activities, produce a TV. guide,...
Curated OER
Water Fun
Students examine uses for water. In this water lesson, students discuss how they use water. As a class students make a PowerPoint by naming one swimming safety rule. Students compare and contrast fishing for fun and fishing for survival.
Alabama Learning Exchange
The World of Integers
Review operations related to rational numbers and integers using the include PowerPoint presentation, "Interesting Integers." Young mathematicians classify rational numbers as being natural, whole, or integers and read an article about...
Curated OER
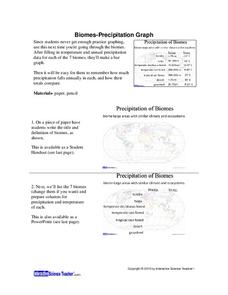
Biomes: Precipitation Graph
Students practice graphing by studying biomes. In this precipitation lesson, students graph the precipitation patterns for the 7 biomes on Earth. Students view a PowerPoint presentation in class which explores the 7 biomes...
Curated OER
Graphing Quadratic Functions
Students graph quadratic functions. In this algebra lesson, students identify the vertex and intercepts of a quadratic equations and graph the parabola. They find the axis of symmetry and make a table to find the values of the parabola.
Curated OER
Solving Inequalities and Graphing
Students solve and graph inequalities on a number line. In this algebra lesson, students solve using addition, subtraction, multiplication and division and graph their solutions using open or closed circles. They graph with 80%-90%...
Curated OER
Coin Tossing and Graphing
Fifth graders use technology as assistance to collecting random data. Through the random data they will be able to explain the significance of getting a head or tail depending on what was previously landed on. They will then analyze the...


