Curated OER
Getting to the Core of Climate Change
Students investigate climate changes by graphing and analyzing ice core data from Greenland and Antarctica. They create, explain and report the pattern of data on a graph of ice core data. In addition they find relationships between the...
Curated OER
Then and Now
Students conduct research and use census data to compare different times and places. In this census lesson, students interpret data from charts and graphs, comparing census information from two time periods as well as from two different...
Curated OER
Water on the Moon!
In this moon worksheet, students read about the data collected from the Deep Impact/EPOXI and Cassini missions to the moon that have detected the presence of hydroxyl molecules under the moon's polar craters. Students solve 4 problems...
Curated OER
Polluting the Environment
Fourth graders construct mini-ecosystem, pollute the ecosystem, observe, collect, and record data on the effects of these pollutants on their ecosystem, organize data on spreadsheets, create graphs, and design presentations to share with...
Curated OER
Straw Breathing Exercise
Students fill out an anonymous questionaire to explore whether they might have asthma. They then set up a spreadsheet to enter the data, decide on a definition of asthma, and figure out the prevalence of asthma. Pupils simulate what it...
Curated OER
Graphing and Analyzing
In this graphing and analyzing worksheet, 9th graders first state if each graph represents a linear or nonlinear relationship. Second, they create a difference table for each set of data presented and determine whether it represents a...
Curated OER
State Economy Chart
Fifth graders research and record statistics on the economy of an assigned state. They create a spreadsheet in Excel to report the data and a 3D Pie graph using the Chart Wizard in Excel to represent their states' data.
Curated OER
Count The Letters
Students perform activities involving ratios, proportions and percents. Given a newspaper article, groups of students count the number of letters in a given area. They use calculators and data collected to construct a pie chart and bar...
Curated OER
Dinosaur Tracks: From Stride To Leg Length To Speed
Students determine the relationship between leg length, stride length, and speed in humans and bipedal dinosaurs. They collect data and graph these human characteristics then use actual data collected from dinosaur track pads and fossils...
Curated OER
Using Excel To Teach Probability And Graphing
Students engage in the use of technology to investigate the mathematical concepts of probability and graphing. They use the skills of predicting an outcome to come up with reasonable possibilities. Students also practice using a...
Curated OER
The Big Bang-Hubble's Law
In this Hubble's law worksheet, students use data for galaxies which include their distance and speed. Students make a graph to show the distance to each galaxy and the speed of each galaxy. They use their graph to answer 4 questions...
Curated OER
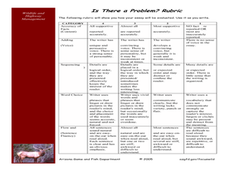
Is There a Problem with Wildlife on our Roads?
Learners create a graph and analyze it to see if the data shows there is a problem with wildlife on the roads. In this wildlife collision instructional activity students write an essay to support their conclusions.
Curated OER
How Do We Solve the Problem of Wildlife on Our Roads?
Students analyze data on elk ecology and movements across the highway. In this ecology lesson, students research ways to save them from highway collisions. They write a report and present their findings in class.
Curated OER
Crunching the Numbers on Dating Violence
Students read about potential violent relationships and beliefs about dating. In this relationship instructional activity students use graphs to examine data about healthy realtionshipsand draw conclusions on their results.
Curated OER
Pocahontas: One Foot in Two Worlds
Students draw upon the visual data presented in photographs, paintings, cartoons, and architectural drawings in order to clarify, illustrate, or elaborate upon information presented in the historical narrative.
Curated OER
Conceptualizing an Experiment
Young scholars work together to design an experiment. They discover the origin of a family artifact. They analyze the data and discuss the results. They determine if the experiment is the best way to find out this type of information.
Curated OER
Global Warming Statistics
Students research and collect data regarding temperature changes for a specific location and find the mean, median, and mode for their data. In this climate change lesson, students choose a location to research and collect data regarding...
Curated OER
The Tipping Point
Students rewrite word problems and solve using math. In this word problem lesson, students gather data and observe the data. They relate this process to the scientific method and math. They review their data to be able to answer...
Curated OER
Voting And Elections
Students examine the voting practices of the past several presidential elections while using data to determine the influence of different factors. They identify the reasons for high or low voter turnout and then display the outcome of...
Curated OER
Measuring Biodiversity
Learners collect species data from a mock intertidal community. In this biology lesson, students graph their data and analyze the species in it. They construct a species accumulation curve and present it to class.
Curated OER
Who Are the Aliens in Our Inland Seas?
Students work in teams to research specific landforms in Great Lakes Watershed, compile information into data table, and write legend explaining landform for children's book. Students then research area surrounding landform, compile...
Curated OER
A Statistical Study of Three Biomes
Students collect data from one of three selected biomes. Data are then organized and statistically analyzed. This project engages students of different backgrounds grouped cooperatively in a relevant outdoor hands-on learning experience.
Curated OER
Brays Bayou Spiderwort Genetic Study
Young scholars formulate hypothesis based upon data gathered by examining possible crosses of spiderworts using Punnett squares. They present explanations for physiological adaptations of spiderworts that resulted from interactions...
Curated OER
Weather Forecasting
Fourth graders explore the concepts of weather forecasting. Students locate the current weather in a specified city. In groups, they record the specified weather information and make predictions of weather. Students justify their...


