Curated OER
Line graphs
In this line graphs worksheet, students read 2 line graphs and answer short answer questions about them. Students answer 5 questions for each graph.
Curated OER
Binomial Distribution
Students explore the concept of binomial distribution. In this binomial distribution activity, students perform binomial distributions on a number of problems in this lecture activity. Students find the mean and variance of binomial...
Curated OER
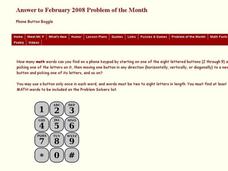
Phone Button Boggle
For this phone button boggle worksheet, students identify the number of math words they can find on a phone keypad according to given directions. This one-page worksheet contains one problem. Answers are provided.
Curated OER
Finding Mean, Mode and Median in the Computer Lab
Students create spreadsheets which will display and figure mean, median, and mode of a set of numbers.
Curated OER
Figuring Elapsed Time
Students discover the concept of elapsed time. For this calculating time lesson, students utilize the Internet to complete record sheets based on the concept of elapsed time. Finally, the students answer questions on their own.
Curated OER
Sampling Snoops
Pupils practice formulating a hypothesis and designing an experiment to test the hypothesis. They identify several sampling techniques they can use to test their hypotheses.
Curated OER
Scale Me Down
Students create scale drawings, and ultimately scale models, of real-world objects in this Math lesson about ratios, proportion, scaling factors, and cross products. The lesson includes ideas for cross-curricular extensions and is...
Curated OER
M&M Caper
Students participate in a game with M&M's to be introduced to percents and ratios. Individually, they estimate and record the number of candies they believe the bag holds and the amount of each colored candy. They open the bag and...
Curated OER
Stem-and- Leaf Plots
Students are introduce to the notion of stem-and-leaf plots. They use stem-and-leaf plots to calculate the mean, median, and mode of a set of data. Students use computers to learn about stem-and-leaf plots.
Curated OER
Tracking the Wild Ones
Students apply mathematic skills to discover the extent of the concern for endangered species. Students analyze graphs and look for trends in graphed results of endangered species on a global level.
Curated OER
The Estimation Station
Students challenge "common knowledge" against newly learned estimation strategies and put those strategies into use. They consider variables in estimating different groups of objects and practice skills of representing numbers.
Curated OER
RISKY BUSINESS--OR NOT!
Students learn about the importance and risk that stocks carry within a business. In this financial management lesson, students use role play and case scenario situations to decide what stocks are best for given companies. Based on the...
Curated OER
Lines of Best Fit
High schoolers explore the concept of line of best fit. In this line of best fit lesson, students find lines of best fit in examples about riding your bike home from school and dentistry. High schoolers find two data points and find the...
Curated OER
Sampling Techniques
Sixth graders examine how to select samples and apply them to an experiment. For this sampling lesson, 6th graders use a bag of yellow and blue cubes to take a sample. They predict how many of each color there are the bag. They set up...
Curated OER
Lesson 56
Sixth graders practice Least Common Multiple in fractions. For this fraction lesson, 6th graders look at two different fractions and find a common denominator. They sing a song to memorize mean, median, and mode.
Curated OER
Box Plots
Students review the concept of median, explore how to calculate quartiles for any size data set and experience how to build a box plot.
Curated OER
What on Earth is Greater Than?
Students compare things that are greater than, less than, or equal to, compare the Earth to other planets, and list planets from greatest size to smallest size.
Curated OER
Getting A Grip On Graphs
Fourth graders gather variety of data and create a graphs to display the data.
Curated OER
Estimation Investigation
Learners view an interactive video to explore the concepts of estimation. They work cooperatively to measure, make comparisons, make predictions, and verify results.
Curated OER
Frequency Distributions and Measures of Central Tendency
Twelfth graders use the Internet to research information on NFL players and construct frequency distributions from the data. They calculate the mean, medium and analyze their data.
Curated OER
Putting Your Best Foot Forward
Third graders measure their feet and their parents' feet, record data on computer-generated graphs, and calculate and record mean, median, and mode.
Curated OER
Sets an the Venn Diagram
Students explore the characteristics of sets and Venn Diagrams. Given data, students practice determining the placement of elements in a Venn Diagram. Students discuss the correspondence between data sets and their graphical...
Curated OER
Histograms and Bar Graphs
Students are introduced to histograms, bar graphs, and the concept of class interval. They use an activity and three discussions with supplemental exercises to help students explore how data can be graphically represented (and...
Curated OER
Geometry and Measurement
Middle schoolers view a right triangle displayed by the teacher. Students measure legs and the interior angles of the triangle. They look for a pattern or relationship between the legs and angles. Middle schoolers use pegboards and...


