Curated OER
An Introduction to the Natural Logarithm (ln)
Students explore the dose response principle, an introduction to what the "natural log" (ln) is and how it behaves. They create and analyze a dose response graph.
Curated OER
Fossil Fuels and Its Effects On The World
Young scholars explore the effects of a declining fossil fuel system would have on the world. They read the line graph and other information to answer questions about fossil fuels. Students use mathematics to analyze graphical data and...
Curated OER
Discovering Pi
Students develop a formula that describes the functional relationship of the circumference of a circle to its diameter. Working with a partner, they measure the diameter and circumference of circular objects in order to discover the...
Curated OER
Forensics 101
Students interpret how to communicate information and ideas in ways that are appropriate to the purpose and audience through spoken, written, and graphic means of expression. They use information-gathering techniques, analyze and...
Curated OER
The Human Line Plot
Fifth graders collect data and use charts and line plots to graph data. Through class surveys, 5th graders collect data concerning a particular subject. They graph their data using a line graph. Students make inferences and predictions...
Curated OER
Fraction Dominoes
Fourth graders participate in a math game that involves practicing their equivalent fraction skills in the advanced multiplication stage seven. They assess their ability skills of equivalent fractions to match twenty seven dominoes on...
Curated OER
Designing Samples/Simple Random Samples
Students explore the concept of sampling techniques. In this sampling techniques lesson, students identify possible sources of bias in situations such as phone polls, supermarket surveys, and drawing names from a phone book. Students...
Curated OER
Line of Best Fit
Students explore the concept of linear regression. In this linear regression instructional activity, students do a Barbie bungee activity where they collect linear data. Students plot their data using a scatter plot. Students determine a...
Curated OER
Making Bar Graphs
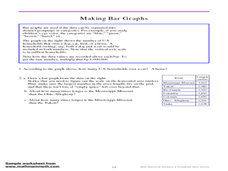
In this bar graph worksheet, learners answer short answer questions about bar graphs. Students answer 1 question about a bar graph about a cat, and 3 questions about a bar graph about U.S. rivers.
Curated OER
Mean, Mode and Bar Graphs
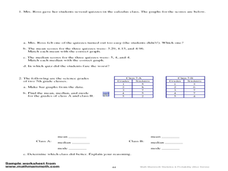
In this mean, mode and bar graphs worksheet, 5th graders analyze the data given, then answer three questions about a bar graph and the data shown.
Curated OER
Using mean, median, and mode
In this mean, median, and mode activity, students read how to use each method and then complete problems using each one. Students complete 8 problems.
Curated OER
Data Analysis
Twelfth graders collect and analyze data. In this secondary end-of-course mathematics lesson, 12th graders formulate a question they would like to answer and decide on an appropriate means of data collection. Students present their...
Curated OER
Does Shape Affect Drag?
Students study drag and how it affects a parachute in the sky. In this parachutes lesson students build models and compare their drag.
Curated OER
Graphing Fun In Third Grade
Third graders display information in a graph, table, and chart. In this data lesson plan, 3rd graders look at graphs, tables, and charts, discuss their importance, and make their own.
Curated OER
Mathematical Problem Solving
Second graders solve story problems. In this story problem activity, 2nd graders solve the problems and explain how they came up with their answers. They create their own story problems to be solved.
Curated OER
How Do They Relate? Linear Relationship
Students collect information and use a line to represent it. In this algebra lesson, students investigate real world data to see if it makes a line. They graph the line comparing the relationship of the x axis with that of the y axis.
Curated OER
Will Exams Be Cancelled?
If the flu outbreak continues, exams will have to be canceled. Investigate the properties of exponential and logarithmic functions. In this algebra lesson plan, young scholars use the TI to examine and differentiate between exponential...
Curated OER
Stem-and-Leaf Plots
Young scholars are introduced to stem-and-leaf plots and calculating the mean, median, and mode from the plots.
Curated OER
Let's Go Camping
Fifth graders plan a budget for a camping trip. They use a spreadsheet to organize the budget and word processing justification for their choices.
Curated OER
All Those Advertising Dollars!
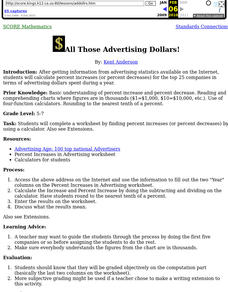
Students calculate percent increases (or percent decreases) for the top 25 companies in terms of advertising dollars spent during a year.
Curated OER
Recording Treasure
Young scholars participate in a garage sale. They will weigh the items sold. They will calculate the total weight of items sold and donated to an agency.
Curated OER
Graphs - On the Floor and Ask a Friend
Students create a floor graph and then interview their classmates to create their own graph.
Curated OER
A Real Difference
Fifth graders use the Celsius and Fahrenheit thermometers to compare temperature readings. They use the Internet to find the temperatures of selected cities. After data is collected for five days, 5th graders graph the temperatures.
Curated OER
One Square Foot
Students identify, describe, count, tally, and graph life found in one square foot of land.


