Hi, what do you want to do?
Texas Instruments
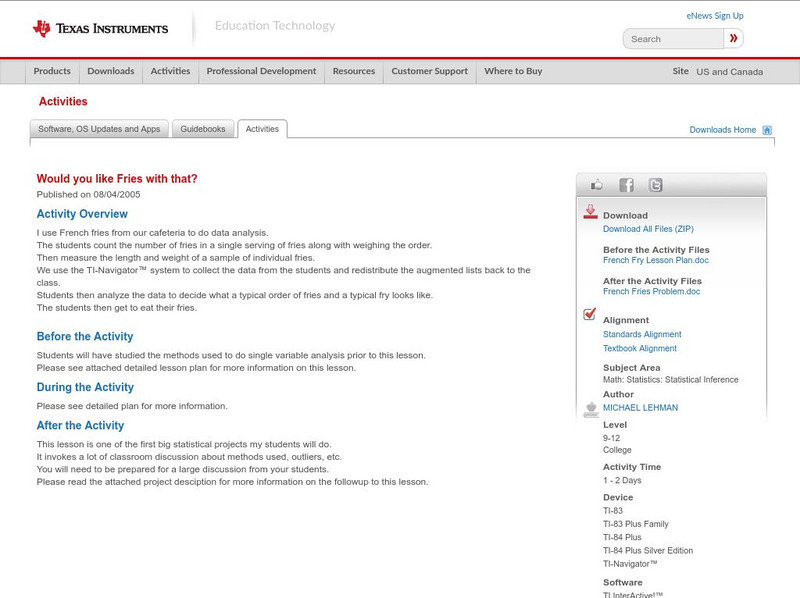
Texas Instruments: Would You Like Fries With That?
French fries from your cafeteria to do data analysis. The students count the number of fries in a single serving of fries along with weighing the order, then measure the length and weight of a sample of individual fries. You then use the...
University of Baltimore
University of Baltimore: Geometric Mean
A complete definition of geometric mean in the statistical concept of the word. The discussion includes several examples of how geometric means are calculated and how/where they are useful. Written by Dr. Hossein Arsham.
Science Education Resource Center at Carleton College
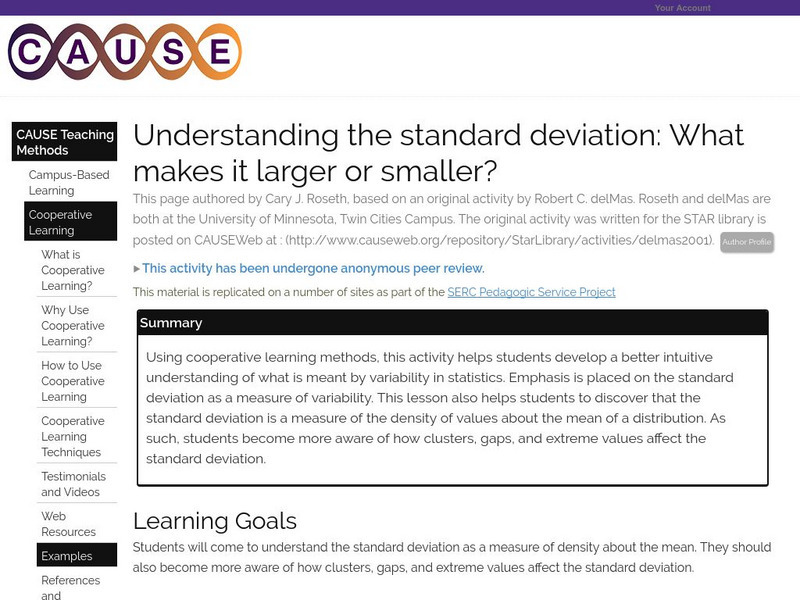
Serc: Understanding the Standard Deviation: What Makes It Larger or Smaller?
Learners develop a better intuitive understanding of what is meant by variability in statistics. Emphasis is placed on the standard deviation as a measure of variability.
National Council of Teachers of Mathematics
The Math Forum: Traffic Jam Activity Lesson Plan
There are seven stepping stones and six people - three on the left facing the three on the right. How is it possible to have the three on the left end up on the right, and vice versa, while everyone was at all times standing on a stone...
Khan Academy
Khan Academy: Markov Chains
The concept of modeling sequences of random events using states and transitions between states became to known as Markov Chains. Introduction to Markov chains. Created by Brit Cruise.
Math Planet
Math Planet: Pre Algebra: Finding the Odds
Discover how to find the odds or chance of an event occurring by taking a look at an example and a video lesson.
Cyberbee
Adventures of Cyberbee: Graphing
Teacher-directed lesson plan focusing on data analysis, graphing, and probability. Lesson includes a video and engaging spreadsheet activities.
University of St. Andrews (UK)
University of St. Andrews: History of Mathematics: Abraham De Moivre
This site contains biographical information and works of the mathematician Abraham DeMoivre.
Khan Academy
Khan Academy: Scatterplots and Correlation Review
A scatterplot is a type of data display that shows the relationship between two numerical variables. Each member of the dataset gets plotted as a point whose x-y coordinates relates to its values for the two variables.
CK-12 Foundation
Ck 12: Statistics: Independent Events and Sample Spaces Grades 9 10
[Free Registration/Login may be required to access all resource tools.] Covers the multiplication rule for independent events.
Purple Math
Purplemath: Practical Algebra Lessons
Pre-Algebra and algebra lessons, from negative numbers through Pre-Calculus. Grouped by level of study. Lessons are practical in nature, informal in tone, and contain many worked examples and warnings about problem areas and probable...
ClassFlow
Class Flow: Probability
[Free Registration/Login Required] This flipchart gives students the opportunity for hands on exploration of probabilities using the dice tool and other real life probability cases. The lesson concludes with a 5 question Activote session.
ClassFlow
Class Flow: Probability Spinner Handling Data
[Free Registration/Login Required] Students construct a probability spinner and then test, graph and analyze their data.
Richland Community College
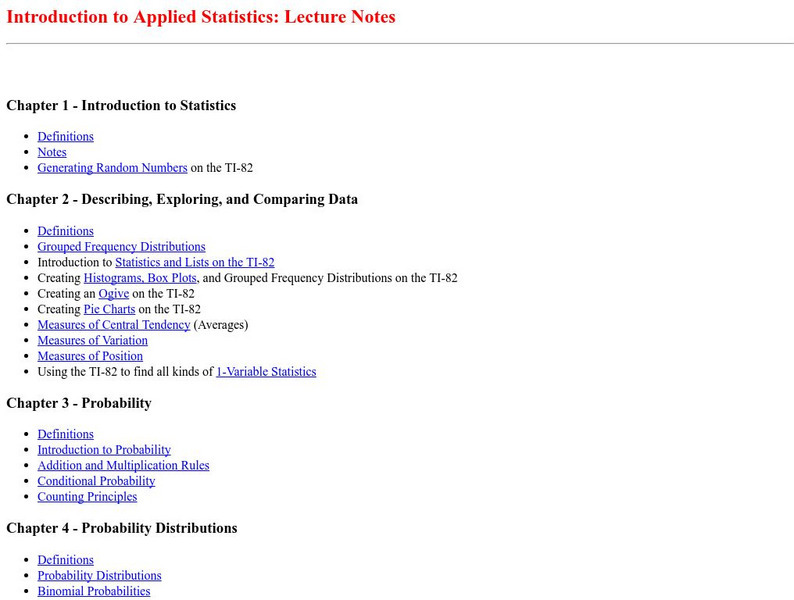
Richland Community: Introduction to Applied Statistics
This site from the Richland Community College provides lecuture notes from a class neatly organized and easy to read. Has some good information.
CK-12 Foundation
Ck 12: Statistics: Dependent Events and Sample Spaces Grades 9 10
[Free Registration/Login may be required to access all resource tools.] Covers the Multiplication Rule for dependent events.
CK-12 Foundation
Ck 12: Statistics: Independent Events and Sample Spaces
[Free Registration/Login may be required to access all resource tools.] Covers the multiplication rule for independent events.
Other
Berrie's Statistics Page: Central Limit Theorem
Brief definition and example of the Central Limit Theorem.
Duke University
Duke University: Web Feats Ii: Lessons on Regression at Hessian
This site has several lessons on regression, "Designed to help students visualize topics associated with lines of regression, given a set of data points." Go to the teacher notes to find the objectives and standards which apply.
Shmoop University
Shmoop: Basic Statistics & Probability: Scatter Plots & Correlation
The statistics resource explores scatter plots and correlation. Students learn about the concepts through notes and detailed examples. The resource consists of practice exercises to check for comprehension of the topics.
Khan Academy
Khan Academy: Hypothesis Testing in Experiments
Look at the results of different experiments, and determine if they are statistically significant. Students receive immediate feedback and have the opportunity to try questions repeatedly, watch a video or receive hints.
Annenberg Foundation
Annenberg Learner: Sampling the Electorate
As the pollster for candidate Higgins, you need to know how she is faring with different groups. Read her political profile, view the demographic profile of the city, decide on the groups to poll, review the results and learn about...
Khan Academy
Khan Academy: Transforming Data Problem
It is very common to take data and apply the same transformation to every data point in the set. For example, we may take a set of temperatures taken in degrees fahrenheit and convert them all to degrees celsius. How would this...
Annenberg Foundation
Annenberg Learner: Cast Your Vote!
Cast your vote and answer some questions on the accuracy, usefulness, and impact of polls. Then read about what role polls play in an election.
Khan Academy
Khan Academy: Making Inferences From Random Samples
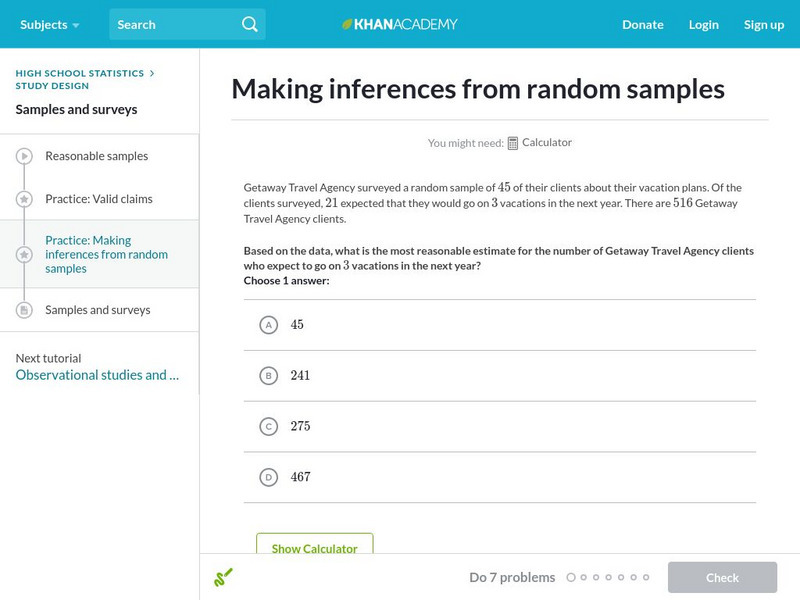
Given a random sample, practice figuring out what can we reasonably infer about the entire population? Students receive immediate feedback and have the opportunity to try questions repeatedly, watch a video or receive hints.


